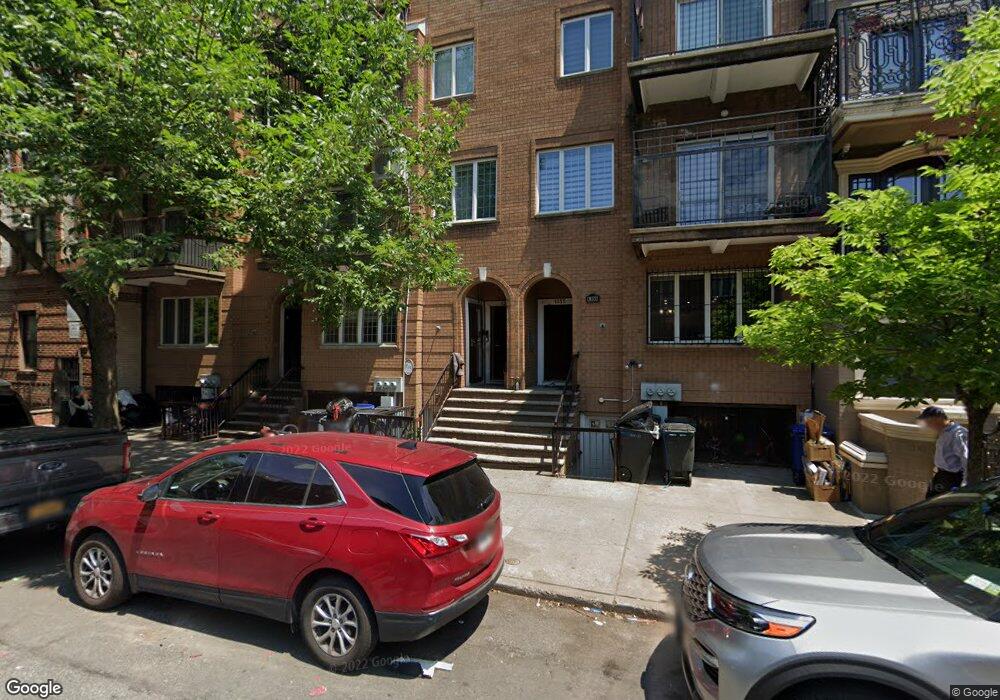
1353 51st St Unit 2 Brooklyn, NY 11219
Borough Park NeighborhoodEstimated Value: $981,141 - $1,067,000
--
Bed
--
Bath
1,295
Sq Ft
$784/Sq Ft
Est. Value
About This Home
This home is located at 1353 51st St Unit 2, Brooklyn, NY 11219 and is currently estimated at $1,014,785, approximately $783 per square foot. 1353 51st St Unit 2 is a home located in Kings County with nearby schools including P.S. 164 Caesar Rodney School, I.S. 223 The Montauk, and Franklin Delano Roosevelt High School.
Ownership History
Date
Name
Owned For
Owner Type
Purchase Details
Closed on
May 5, 2021
Sold by
Teitelbaum Dina P and Teitelbaum Meshilem Z
Bought by
Twerski Dvora Golda
Current Estimated Value
Home Financials for this Owner
Home Financials are based on the most recent Mortgage that was taken out on this home.
Original Mortgage
$521,500
Outstanding Balance
$472,609
Interest Rate
3.1%
Mortgage Type
Purchase Money Mortgage
Estimated Equity
$542,176
Purchase Details
Closed on
May 18, 2020
Sold by
Engelberg Dina
Bought by
Teitelbaum Dina P and Teitelbaum Meshilem Z
Purchase Details
Closed on
Jul 1, 1998
Sold by
Leifer Chana
Bought by
Congregation Beth Moshe
Create a Home Valuation Report for This Property
The Home Valuation Report is an in-depth analysis detailing your home's value as well as a comparison with similar homes in the area
Home Values in the Area
Average Home Value in this Area
Purchase History
| Date | Buyer | Sale Price | Title Company |
|---|---|---|---|
| Twerski Dvora Golda | $775,000 | -- | |
| Teitelbaum Dina P | -- | -- | |
| Congregation Beth Moshe | -- | Commonwealth Land Title Ins |
Source: Public Records
Mortgage History
| Date | Status | Borrower | Loan Amount |
|---|---|---|---|
| Open | Twerski Dvora Golda | $521,500 |
Source: Public Records
Tax History Compared to Growth
Tax History
| Year | Tax Paid | Tax Assessment Tax Assessment Total Assessment is a certain percentage of the fair market value that is determined by local assessors to be the total taxable value of land and additions on the property. | Land | Improvement |
|---|---|---|---|---|
| 2025 | $8,806 | $126,781 | $13,374 | $113,407 |
| 2024 | $8,806 | $105,662 | $13,374 | $92,288 |
| 2023 | $6,600 | $88,052 | $13,374 | $74,678 |
| 2022 | $6,583 | $86,554 | $13,374 | $73,180 |
| 2021 | $6,156 | $69,222 | $13,374 | $55,848 |
| 2020 | $5,682 | $75,855 | $13,374 | $62,481 |
| 2019 | $5,395 | $85,590 | $13,374 | $72,216 |
| 2018 | $6,085 | $50,169 | $6,271 | $43,898 |
| 2017 | $6,162 | $50,169 | $7,250 | $42,919 |
| 2016 | $5,963 | $48,614 | $8,781 | $39,833 |
| 2015 | $2,282 | $45,013 | $9,751 | $35,262 |
| 2014 | $2,282 | $41,679 | $10,831 | $30,848 |
Source: Public Records
Map
Nearby Homes
- 4924 13th Ave
- 1358 53rd St Unit 2B
- 5313 13th Ave
- 5401 15th Ave
- 4709 New Utrecht Ave
- 4726 New Utrecht Ave
- 1117 51st St
- 5812 New Utrecht Ave
- 1240 43rd St
- 4518 11th Ave
- 1241 60th St
- 4906 Fort Hamilton Pkwy
- 4409 New Utrecht Ave
- 977 52nd St
- 1129 60th St
- 975 52nd St
- 1025 45th St Unit 3F
- 1025 45th St Unit 4D
- 1227 40th St
- 969 55th St
- 1353 51st St Unit 3
- 1353 51st St Unit 1
- 1353 51st St
- 1351 51st St Unit 3
- 1351 51st St Unit 2
- 1351 51st St Unit 1
- 1351 51st St
- 1355 51st St Unit 3
- 1355 51st St Unit 2
- 1355 51st St Unit 1
- 1355 51st St
- 1357 51st St
- 1359 51st St
- 1361 51st St Unit C
- 1361 51st St Unit B
- 1361 51st St Unit A
- 1361 51st St
- 1350 50th St
- 1365 51st St
- 1346 50th St