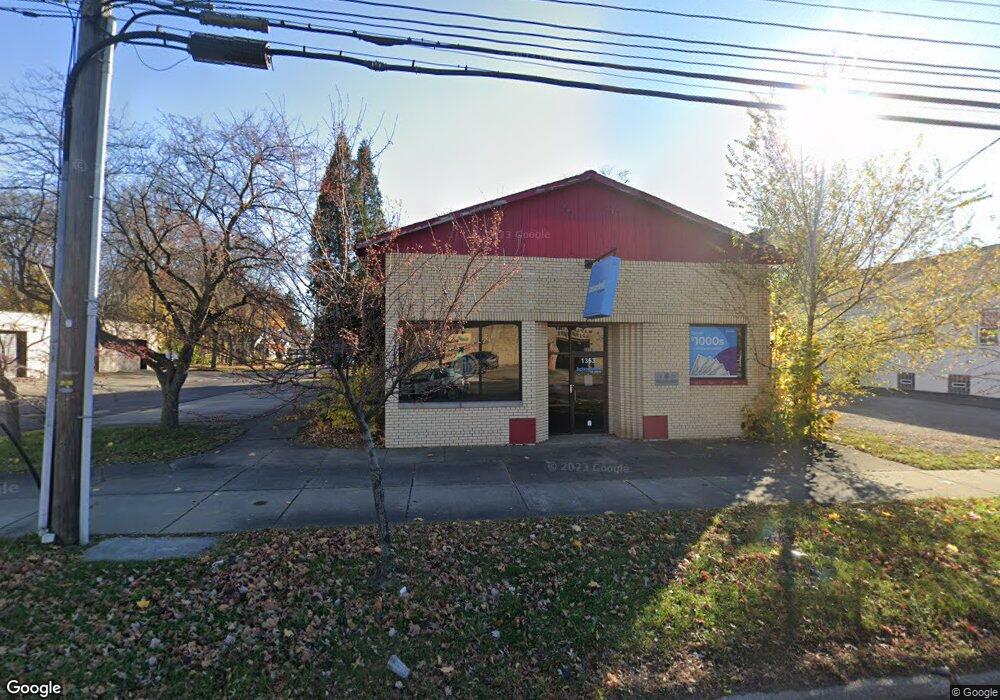
1353 Copley Rd Akron, OH 44320
West Akron NeighborhoodEstimated Value: $66,082
--
Bed
1
Bath
2,560
Sq Ft
$26/Sq Ft
Est. Value
About This Home
This home is located at 1353 Copley Rd, Akron, OH 44320 and is currently estimated at $66,082, approximately $25 per square foot. 1353 Copley Rd is a home located in Summit County with nearby schools including Summit Academy School, Emmanuel Christian Academy, and Julie Billiart School Akron.
Ownership History
Date
Name
Owned For
Owner Type
Purchase Details
Closed on
Aug 29, 2015
Sold by
1353 Copley Llc
Bought by
High 4 Properties Llc
Current Estimated Value
Home Financials for this Owner
Home Financials are based on the most recent Mortgage that was taken out on this home.
Original Mortgage
$89,400
Outstanding Balance
$70,528
Interest Rate
4.04%
Mortgage Type
Future Advance Clause Open End Mortgage
Estimated Equity
-$4,446
Purchase Details
Closed on
Feb 11, 2011
Sold by
Praizner Christopher A and Mauer Lauren
Bought by
1353 Copley Llc
Purchase Details
Closed on
Oct 17, 2001
Sold by
Russo Salvatore A and Russo Sal A
Bought by
Praizner Christopher A
Purchase Details
Closed on
Feb 7, 1996
Sold by
Praizner Christopher A
Bought by
Russo Salvatore A
Home Financials for this Owner
Home Financials are based on the most recent Mortgage that was taken out on this home.
Original Mortgage
$70,000
Interest Rate
7.11%
Mortgage Type
Commercial
Create a Home Valuation Report for This Property
The Home Valuation Report is an in-depth analysis detailing your home's value as well as a comparison with similar homes in the area
Home Values in the Area
Average Home Value in this Area
Purchase History
| Date | Buyer | Sale Price | Title Company |
|---|---|---|---|
| High 4 Properties Llc | $15,000 | Chicago Title Ins Co | |
| 1353 Copley Llc | -- | Accommodation | |
| Praizner Christopher A | $34,100 | Continental Title | |
| Russo Salvatore A | $90,000 | -- |
Source: Public Records
Mortgage History
| Date | Status | Borrower | Loan Amount |
|---|---|---|---|
| Open | High 4 Properties Llc | $89,400 | |
| Previous Owner | Russo Salvatore A | $70,000 |
Source: Public Records
Tax History Compared to Growth
Tax History
| Year | Tax Paid | Tax Assessment Tax Assessment Total Assessment is a certain percentage of the fair market value that is determined by local assessors to be the total taxable value of land and additions on the property. | Land | Improvement |
|---|---|---|---|---|
| 2025 | $4,287 | $40,041 | $9,762 | $30,279 |
| 2024 | $4,073 | $40,041 | $9,762 | $30,279 |
| 2023 | $4,078 | $40,041 | $9,762 | $30,279 |
| 2022 | $4,078 | $40,041 | $9,762 | $30,279 |
| 2021 | $5,040 | $40,041 | $9,762 | $30,279 |
| 2020 | $3,648 | $40,040 | $9,760 | $30,280 |
| 2019 | $1,824 | $32,970 | $7,850 | $25,120 |
| 2018 | $3,631 | $32,970 | $7,850 | $25,120 |
| 2017 | $3,718 | $32,970 | $7,850 | $25,120 |
| 2016 | $3,718 | $34,670 | $8,260 | $26,410 |
| 2015 | $3,718 | $34,670 | $8,260 | $26,410 |
| 2014 | $3,917 | $34,670 | $8,260 | $26,410 |
| 2013 | -- | $34,870 | $7,020 | $27,850 |
Source: Public Records
Map
Nearby Homes
- 911 Hayden Ave
- 1333 Orrin St
- 1381 Orrin St
- 0 Seward Ave
- 1042 Frederick Blvd
- 829 S Hawkins Ave
- 888 Greenwood Ave
- 815 Hayden Ave
- 1024 Roslyn Ave
- 773 Seward Ave
- 739 Roslyn Ave
- 763 Cordova Ave
- 0 Pickford Ave
- 724 Hayden Ave
- 1179 Seward Ave
- 693 Roslyn Ave
- 695 Dorchester Rd
- VL Pickford Ave
- 616 Dorchester Rd
- 560 Mineola Ave