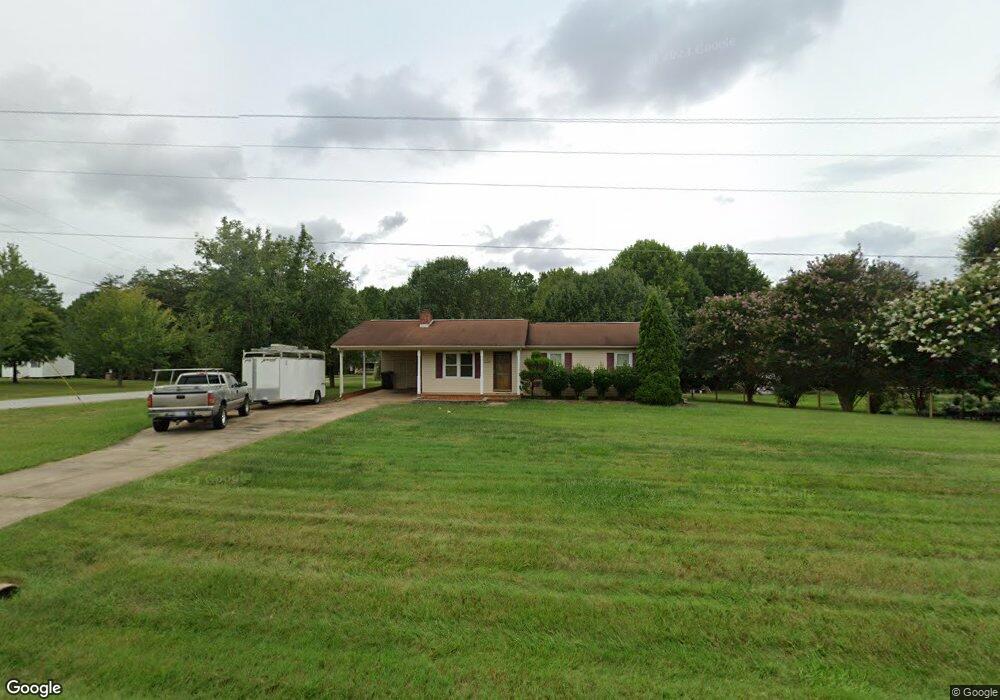
1353 Old Mill Rd Lincolnton, NC 28092
Estimated Value: $224,000 - $248,363
3
Beds
2
Baths
1,008
Sq Ft
$231/Sq Ft
Est. Value
About This Home
This home is located at 1353 Old Mill Rd, Lincolnton, NC 28092 and is currently estimated at $232,591, approximately $230 per square foot. 1353 Old Mill Rd is a home located in Lincoln County with nearby schools including Pumpkin Center Primary, Pumpkin Center Intermediate, and North Lincoln Middle School.
Ownership History
Date
Name
Owned For
Owner Type
Purchase Details
Closed on
Apr 25, 2025
Sold by
Bolen Richard D
Bought by
Avery Zachary Blake
Current Estimated Value
Home Financials for this Owner
Home Financials are based on the most recent Mortgage that was taken out on this home.
Original Mortgage
$213,750
Outstanding Balance
$212,993
Interest Rate
6.65%
Mortgage Type
New Conventional
Estimated Equity
$19,598
Purchase Details
Closed on
Jun 1, 2006
Sold by
First Federal Savings Bank Of Lincolnton
Bought by
Bolen Richard D
Home Financials for this Owner
Home Financials are based on the most recent Mortgage that was taken out on this home.
Original Mortgage
$67,000
Interest Rate
6.44%
Mortgage Type
New Conventional
Purchase Details
Closed on
Mar 30, 2006
Sold by
Whitesides Michael P and Whitesides Patsy B
Bought by
First Federal Savings Bank Of Lincolnton
Create a Home Valuation Report for This Property
The Home Valuation Report is an in-depth analysis detailing your home's value as well as a comparison with similar homes in the area
Home Values in the Area
Average Home Value in this Area
Purchase History
| Date | Buyer | Sale Price | Title Company |
|---|---|---|---|
| Avery Zachary Blake | $225,000 | None Listed On Document | |
| Avery Zachary Blake | $225,000 | None Listed On Document | |
| Bolen Richard D | $72,000 | None Available | |
| First Federal Savings Bank Of Lincolnton | $75,327 | None Available |
Source: Public Records
Mortgage History
| Date | Status | Borrower | Loan Amount |
|---|---|---|---|
| Open | Avery Zachary Blake | $213,750 | |
| Closed | Avery Zachary Blake | $213,750 | |
| Previous Owner | Bolen Richard D | $67,000 |
Source: Public Records
Tax History Compared to Growth
Tax History
| Year | Tax Paid | Tax Assessment Tax Assessment Total Assessment is a certain percentage of the fair market value that is determined by local assessors to be the total taxable value of land and additions on the property. | Land | Improvement |
|---|---|---|---|---|
| 2025 | $1,235 | $175,461 | $38,000 | $137,461 |
| 2024 | $1,215 | $175,461 | $38,000 | $137,461 |
| 2023 | $1,210 | $175,461 | $38,000 | $137,461 |
| 2022 | $1,070 | $128,344 | $30,000 | $98,344 |
| 2021 | $1,070 | $128,344 | $30,000 | $98,344 |
| 2020 | $929 | $128,344 | $30,000 | $98,344 |
| 2019 | $904 | $128,344 | $30,000 | $98,344 |
| 2018 | $836 | $102,582 | $28,000 | $74,582 |
| 2017 | $729 | $102,582 | $28,000 | $74,582 |
| 2016 | $729 | $102,582 | $28,000 | $74,582 |
| 2015 | $801 | $102,582 | $28,000 | $74,582 |
| 2014 | $828 | $107,938 | $28,000 | $79,938 |
Source: Public Records
Map
Nearby Homes
- 1448 Weatherwood Dr
- 4465 Brancer Ln
- 2914 Weatherfield Dr
- 2911 Weatherfield Dr
- 1076 Furnace Rd
- 341 Camp Creek Rd
- 370 Sherrill Farm Rd
- 1471 Arden Dr
- 1335 Huckleberry Dr
- 2206 Carpenter Farms Dr
- 2202 Carpenter Farms Dr
- 1711 Furnace Road Extension
- 000 N Carolina 73
- 000 Curveview Rd
- 3164 Andrew Link Rd
- 222 McMillian Heights Rd
- 1850 Furnace Rd
- 2515 Myra Ln
- 32 Miners Creek Dr
- 5045 Amity Ln Unit 12
- 1369 Old Mill Rd
- 1387 Old Mill Rd
- 1333 Old Mill Rd
- 1385 Old Mill Rd
- 1330 Old Mill Rd
- 3625 Windsor Trail
- 1350 Old Mill Rd
- 1403 Old Mill Rd
- 1313 Old Mill Rd
- 3601 Windsor Trail
- 3602 Windsor Trail
- 1419 Old Mill Rd
- 1427 Old Mill Rd
- 3584 Windsor Trail
- 1424 Old Mill Rd
- 1290 Old Mill Rd
- 4121 Asbury Church Rd
- 1451 Old Mill Rd
- 3571 Windsor Trail
- 3568 Windsor Trail