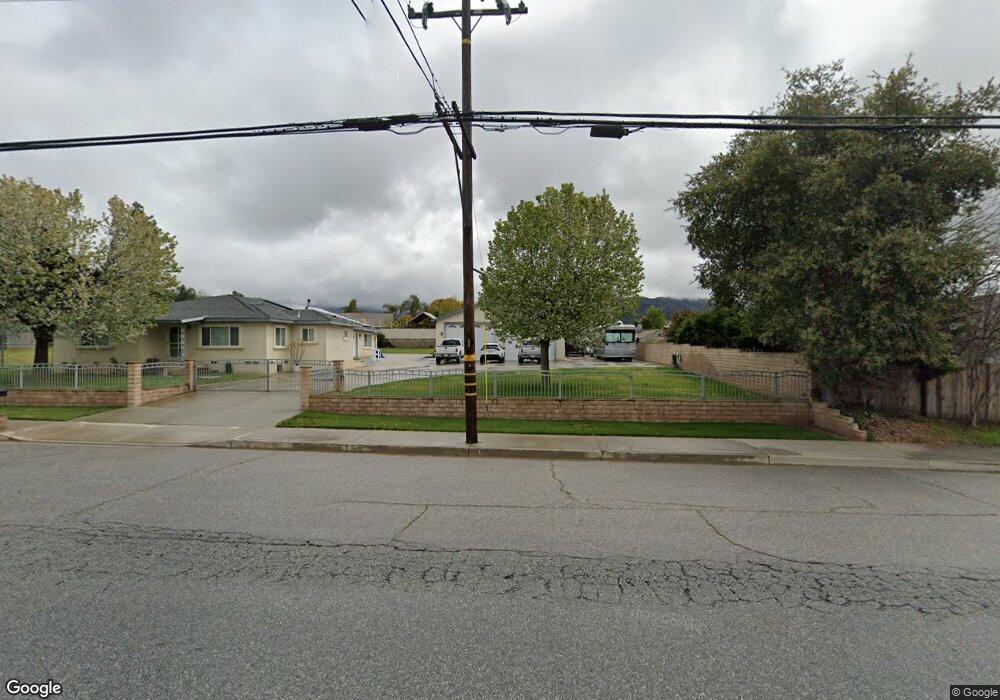
13531 Bryant St Yucaipa, CA 92399
Estimated Value: $591,000 - $708,000
3
Beds
3
Baths
2,343
Sq Ft
$278/Sq Ft
Est. Value
About This Home
This home is located at 13531 Bryant St, Yucaipa, CA 92399 and is currently estimated at $652,415, approximately $278 per square foot. 13531 Bryant St is a home located in San Bernardino County with nearby schools including Wildwood Elementary School, Mesa View Middle School, and Yucaipa High School.
Ownership History
Date
Name
Owned For
Owner Type
Purchase Details
Closed on
Oct 1, 2004
Sold by
Hallberg Corey
Bought by
Hornsby Rob and Hornsby Rhonda
Current Estimated Value
Home Financials for this Owner
Home Financials are based on the most recent Mortgage that was taken out on this home.
Original Mortgage
$170,000
Outstanding Balance
$83,741
Interest Rate
5.69%
Mortgage Type
New Conventional
Estimated Equity
$568,674
Purchase Details
Closed on
Oct 4, 2000
Sold by
Hallberg Corey
Bought by
Hallberg Corey and Hallberg Lisa
Home Financials for this Owner
Home Financials are based on the most recent Mortgage that was taken out on this home.
Original Mortgage
$43,500
Interest Rate
7.96%
Mortgage Type
Stand Alone Second
Purchase Details
Closed on
Jul 13, 1998
Sold by
Sardegna Angie Revocable Living Trust and Ernie C
Bought by
Hallberg Corey and Clough Lisa
Home Financials for this Owner
Home Financials are based on the most recent Mortgage that was taken out on this home.
Original Mortgage
$98,773
Interest Rate
6.9%
Mortgage Type
FHA
Purchase Details
Closed on
Mar 11, 1997
Sold by
Sardegna Angie
Bought by
Sardegna Angie and The Angie Sardegna Revocable L
Create a Home Valuation Report for This Property
The Home Valuation Report is an in-depth analysis detailing your home's value as well as a comparison with similar homes in the area
Home Values in the Area
Average Home Value in this Area
Purchase History
| Date | Buyer | Sale Price | Title Company |
|---|---|---|---|
| Hornsby Rob | $330,000 | First American | |
| Hallberg Corey | -- | First American Title Ins Co | |
| Hallberg Corey | $99,000 | Universal Title Company | |
| Sardegna Angie | -- | -- |
Source: Public Records
Mortgage History
| Date | Status | Borrower | Loan Amount |
|---|---|---|---|
| Open | Hornsby Rob | $170,000 | |
| Previous Owner | Hallberg Corey | $43,500 | |
| Previous Owner | Hallberg Corey | $98,773 |
Source: Public Records
Tax History
| Year | Tax Paid | Tax Assessment Tax Assessment Total Assessment is a certain percentage of the fair market value that is determined by local assessors to be the total taxable value of land and additions on the property. | Land | Improvement |
|---|---|---|---|---|
| 2025 | $6,189 | $535,585 | $114,999 | $420,586 |
| 2024 | $6,000 | $525,083 | $112,744 | $412,339 |
| 2023 | $5,975 | $514,787 | $110,533 | $404,254 |
| 2022 | $5,906 | $504,693 | $108,366 | $396,327 |
| 2021 | $5,490 | $466,000 | $140,000 | $326,000 |
| 2020 | $5,680 | $442,900 | $132,900 | $310,000 |
| 2019 | $5,461 | $430,000 | $129,000 | $301,000 |
| 2018 | $4,612 | $388,700 | $113,600 | $275,100 |
| 2017 | $4,445 | $375,600 | $109,800 | $265,800 |
| 2016 | $4,177 | $351,000 | $102,600 | $248,400 |
| 2015 | $3,883 | $325,000 | $95,000 | $230,000 |
| 2014 | $3,567 | $299,000 | $90,000 | $209,000 |
Source: Public Records
Map
Nearby Homes
- 13500 San Lucas Dr
- 35475 Bonita Dr
- 13288 Bryant St
- 13576 California St Unit 34A
- 35055 Avenue H
- 975 California St Unit 64
- 975 California St Unit 76
- 975 California St Unit 12
- 975 California St Unit 8
- 375 E County Line Rd
- 34990 County Line Rd
- 13180 Bryant St
- 35662 Avenue H
- 950 California St Unit 40
- 950 California St Unit 82
- 950 California St Unit 49
- 950 California St Unit 60
- 35710 Avenue H
- 35131 Wildwood Canyon Rd
- 1002 California St
- 35316 Santa Rosa Dr
- 35328 Santa Rosa Dr
- 35304 Santa Rosa Dr
- 35340 Santa Rosa Dr
- 13520 San Lucas Dr
- 35357 Santa Maria St
- 35352 Santa Rosa Dr
- 13497 Bryant St
- 35281 Santa Maria St
- 35280 Santa Rosa Dr
- 35364 Santa Rosa Dr
- 13568 San Lucas Dr
- 35363 Santa Maria St
- 35321 Santa Rosa Dr
- 35309 Santa Rosa Dr
- 35271 Santa Maria St
- 35270 Santa Rosa Dr
- 35372 Santa Rosa Dr
- 35281 Santa Rosa Dr
- 13574 San Lucas Dr
Your Personal Tour Guide
Ask me questions while you tour the home.