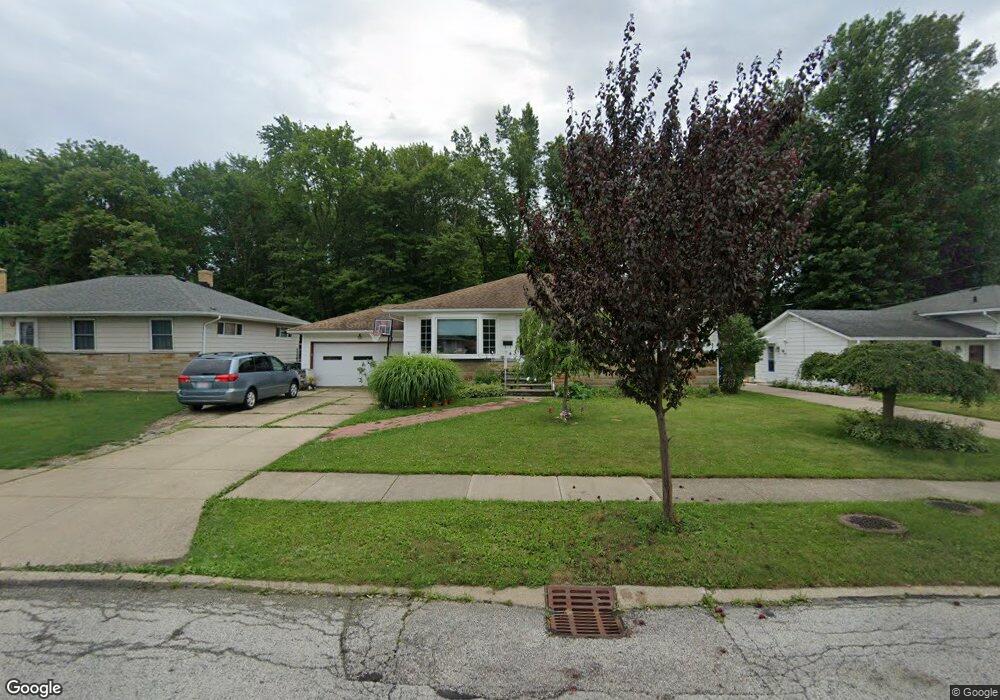
13535 Kathleen Dr Brookpark, OH 44142
Estimated Value: $226,133 - $247,000
3
Beds
1
Bath
1,300
Sq Ft
$180/Sq Ft
Est. Value
About This Home
This home is located at 13535 Kathleen Dr, Brookpark, OH 44142 and is currently estimated at $233,783, approximately $179 per square foot. 13535 Kathleen Dr is a home located in Cuyahoga County with nearby schools including Berea-Midpark Middle School, Berea-Midpark High School, and Huber Heights Preparatory Academy Parma Academy.
Ownership History
Date
Name
Owned For
Owner Type
Purchase Details
Closed on
Oct 11, 2001
Sold by
Lester Herman M and Lester Anne C
Bought by
Cunningham Jerry L
Current Estimated Value
Home Financials for this Owner
Home Financials are based on the most recent Mortgage that was taken out on this home.
Original Mortgage
$85,000
Outstanding Balance
$33,248
Interest Rate
6.88%
Estimated Equity
$200,535
Purchase Details
Closed on
Sep 7, 2000
Sold by
Lester Herman M and Lester Anne C
Bought by
Lester Herman M and Lester Anne C
Purchase Details
Closed on
Jan 24, 2000
Sold by
John F Holowaty & Emily L Holowaty Trust
Bought by
Lester Herman M and Lester Anne C
Purchase Details
Closed on
Jan 6, 1993
Sold by
Holowaty John
Bought by
Holowaty John F Trustee
Purchase Details
Closed on
Dec 19, 1977
Sold by
Holowaty John and Holowaty Emily
Bought by
Holowaty John
Purchase Details
Closed on
Jan 1, 1975
Bought by
Holowaty John and Holowaty Emily
Create a Home Valuation Report for This Property
The Home Valuation Report is an in-depth analysis detailing your home's value as well as a comparison with similar homes in the area
Home Values in the Area
Average Home Value in this Area
Purchase History
| Date | Buyer | Sale Price | Title Company |
|---|---|---|---|
| Cunningham Jerry L | $135,000 | Chicago Title Insurance Comp | |
| Lester Herman M | -- | -- | |
| Lester Herman M | $123,800 | Midland Title Security Inc | |
| Holowaty John F Trustee | -- | -- | |
| Holowaty John | -- | -- | |
| Holowaty John | -- | -- |
Source: Public Records
Mortgage History
| Date | Status | Borrower | Loan Amount |
|---|---|---|---|
| Open | Cunningham Jerry L | $85,000 |
Source: Public Records
Tax History Compared to Growth
Tax History
| Year | Tax Paid | Tax Assessment Tax Assessment Total Assessment is a certain percentage of the fair market value that is determined by local assessors to be the total taxable value of land and additions on the property. | Land | Improvement |
|---|---|---|---|---|
| 2024 | $3,287 | $65,170 | $14,525 | $50,645 |
| 2023 | $3,305 | $54,260 | $11,030 | $43,230 |
| 2022 | $3,282 | $54,250 | $11,030 | $43,230 |
| 2021 | $3,263 | $54,250 | $11,030 | $43,230 |
| 2020 | $2,941 | $43,050 | $8,750 | $34,300 |
| 2019 | $2,853 | $123,000 | $25,000 | $98,000 |
| 2018 | $2,732 | $43,050 | $8,750 | $34,300 |
| 2017 | $2,842 | $39,770 | $8,930 | $30,840 |
| 2016 | $2,818 | $39,770 | $8,930 | $30,840 |
| 2015 | $2,519 | $39,770 | $8,930 | $30,840 |
| 2014 | $2,519 | $37,880 | $8,510 | $29,370 |
Source: Public Records
Map
Nearby Homes
- 6333 W 130th St
- 13879 Zaremba Dr
- 6321 W 130th St
- 13931 Franklyn Blvd
- 13971 Park Dr
- 13493 Pineview Ct
- 13602 Holland Rd
- 6369 Anita Dr
- 13689 Pineview Ct
- 6274 Anita Dr
- 6413 Alexandria Dr
- 13489 Havendale Dr
- 14055 Donald Dr
- 6640 Pearl Rd Unit 402
- 14340 Kingman Dr
- 6682 Parma Park Blvd
- 6330 Michael Dr
- 6697 Parma Park Blvd
- 6771 Wood Creek Dr
- 6943 N Parkway Dr Unit H6943
- 13515 Kathleen Dr
- 13589 Kathleen Dr
- 13495 Kathleen Dr
- 13609 Kathleen Dr
- 13536 Kathleen Dr
- 13516 Kathleen Dr
- 13475 Kathleen Dr
- 13590 Kathleen Dr
- 13633 Kathleen Dr
- 13496 Kathleen Dr
- 13608 Kathleen Dr
- 13328 Sheldon Rd
- 13476 Kathleen Dr
- 13455 Kathleen Dr
- 13346 Sheldon Rd
- 13630 Kathleen Dr
- 6421 Terre Dr
- 6433 Terre Dr
- 13368 Sheldon Rd
- 13456 Kathleen Dr