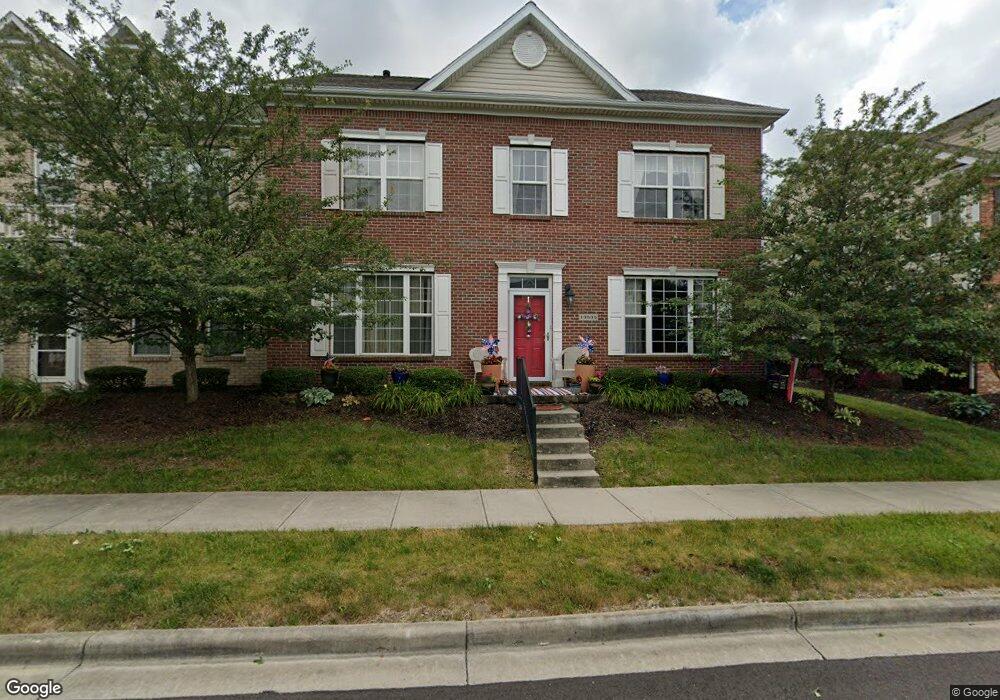
13535 Molique Blvd Unit 904 Fishers, IN 46037
Estimated Value: $322,000 - $339,000
3
Beds
3
Baths
2,363
Sq Ft
$140/Sq Ft
Est. Value
About This Home
This home is located at 13535 Molique Blvd Unit 904, Fishers, IN 46037 and is currently estimated at $331,005, approximately $140 per square foot. 13535 Molique Blvd Unit 904 is a home located in Hamilton County with nearby schools including Overland Park Elementary School, Thorpe Creek Elementary School, and Hamilton Southeastern Intermediate / Junior High.
Ownership History
Date
Name
Owned For
Owner Type
Purchase Details
Closed on
Sep 17, 2009
Sold by
Louisville Realty Corporation
Bought by
Wesleyan Investment Foundation
Current Estimated Value
Purchase Details
Closed on
Feb 10, 2009
Sold by
Southwest Bank
Bought by
Louisville Realty Corporation
Purchase Details
Closed on
Nov 24, 2008
Sold by
Portrait Homes Hanover On The Green Llc
Bought by
Southwest Bank
Create a Home Valuation Report for This Property
The Home Valuation Report is an in-depth analysis detailing your home's value as well as a comparison with similar homes in the area
Home Values in the Area
Average Home Value in this Area
Purchase History
| Date | Buyer | Sale Price | Title Company |
|---|---|---|---|
| Wesleyan Investment Foundation | -- | Stewart Title | |
| Louisville Realty Corporation | -- | None Available | |
| Southwest Bank | -- | None Available |
Source: Public Records
Tax History Compared to Growth
Tax History
| Year | Tax Paid | Tax Assessment Tax Assessment Total Assessment is a certain percentage of the fair market value that is determined by local assessors to be the total taxable value of land and additions on the property. | Land | Improvement |
|---|---|---|---|---|
| 2024 | $2,736 | $264,500 | $42,800 | $221,700 |
| 2023 | $2,736 | $258,400 | $42,800 | $215,600 |
| 2022 | $2,877 | $241,900 | $42,800 | $199,100 |
| 2021 | $2,613 | $226,000 | $42,800 | $183,200 |
| 2020 | $2,369 | $206,200 | $42,800 | $163,400 |
| 2019 | $2,280 | $199,500 | $37,000 | $162,500 |
| 2018 | $2,160 | $191,500 | $37,000 | $154,500 |
| 2017 | $3,150 | $136,700 | $37,000 | $99,700 |
| 2016 | $3,086 | $134,700 | $37,000 | $97,700 |
| 2014 | $2,939 | $137,700 | $43,100 | $94,600 |
| 2013 | $2,939 | $132,100 | $43,100 | $89,000 |
Source: Public Records
Map
Nearby Homes
- 13172 Saxony Blvd
- 13484 Molique Blvd
- 13330 Saxony Blvd W
- 13301 Minden Dr
- 13616 Whitten Dr N
- 13423 E 134th St
- 13311 Susser Way
- 12985 Saxony Blvd
- 13288 E Lieder Way
- 13276 E Lieder Way
- 13008 Overview Dr
- 12964 Walbeck Dr
- 13935 Canonbury Way
- 13315 Patriotic Way
- 12957 E 131st St
- 12880 Oxbridge Place
- 12890 Old Glory Dr
- 12997 Bartlett Dr
- 12994 Dekoven Dr
- 14110 Bay Willow Dr
- 13541 Molique Blvd
- 13541 Molique Blvd Unit 903
- 13535 Molique Blvd
- 13547 Molique Blvd
- 13529 Molique Blvd Unit 1001
- 13529 Molique Blvd
- 13529 Molique Blvd Unit 201001
- 13553 Molique Blvd
- 13553 Molique Blvd Unit 901
- 13523 Molique Blvd
- 13540 E 131st St
- 13546 E 131st St
- 13546 E 131st St Unit 1203
- 13552 E 131st St
- 13517 Molique Blvd
- 13517 Molique Blvd Unit 10
- 13528 E 131st St Unit 13
- 13522 E 131st St
- 13532 Molique Blvd
- 13538 Molique Blvd