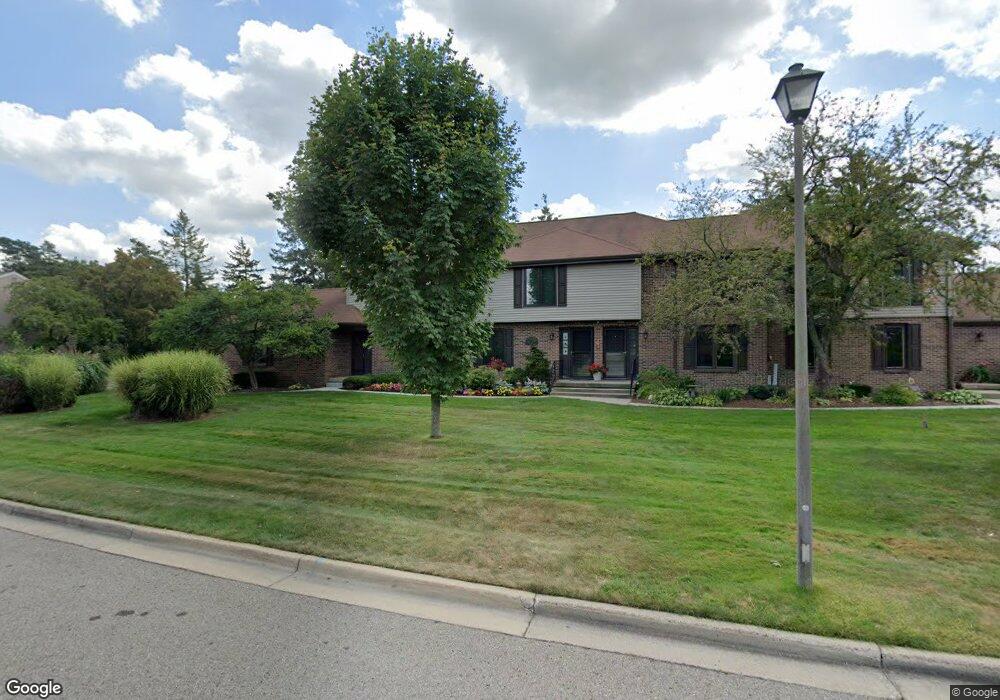
1354 Chartwell Carriage Way N East Lansing, MI 48823
Estimated Value: $209,000 - $229,582
3
Beds
1
Bath
1,300
Sq Ft
$166/Sq Ft
Est. Value
About This Home
This home is located at 1354 Chartwell Carriage Way N, East Lansing, MI 48823 and is currently estimated at $216,396, approximately $166 per square foot. 1354 Chartwell Carriage Way N is a home located in Ingham County with nearby schools including Green Elementary School, MacDonald Middle School, and East Lansing High School.
Ownership History
Date
Name
Owned For
Owner Type
Purchase Details
Closed on
Aug 4, 2025
Sold by
Sandra J Farrell Trust
Bought by
Hoppe Bradley Daniel
Current Estimated Value
Purchase Details
Closed on
Aug 14, 2003
Sold by
Farrell Sandra J
Bought by
Farrell Sandra J and The Sandra J Farrell Trust
Home Financials for this Owner
Home Financials are based on the most recent Mortgage that was taken out on this home.
Original Mortgage
$76,200
Interest Rate
5.69%
Purchase Details
Closed on
Oct 15, 2002
Sold by
Farrell Sandra J
Bought by
Farrell Sandra J and Sandra J Farrell Trust
Purchase Details
Closed on
Aug 26, 1997
Sold by
Lafkas Cynthia D
Bought by
Farrell Sandra J
Purchase Details
Closed on
Jun 1, 1994
Purchase Details
Closed on
Oct 1, 1989
Purchase Details
Closed on
Apr 1, 1979
Create a Home Valuation Report for This Property
The Home Valuation Report is an in-depth analysis detailing your home's value as well as a comparison with similar homes in the area
Home Values in the Area
Average Home Value in this Area
Purchase History
| Date | Buyer | Sale Price | Title Company |
|---|---|---|---|
| Hoppe Bradley Daniel | $206,000 | Greater Lansing Title | |
| Farrell Sandra J | -- | Citizens Title Services Inc | |
| Farrell Sandra J | -- | Citizens Title Services Inc | |
| Farrell Sandra J | -- | -- | |
| Farrell Sandra J | $99,000 | -- | |
| -- | $97,000 | -- | |
| -- | $82,900 | -- | |
| -- | $63,900 | -- |
Source: Public Records
Mortgage History
| Date | Status | Borrower | Loan Amount |
|---|---|---|---|
| Previous Owner | Farrell Sandra J | $76,200 |
Source: Public Records
Tax History Compared to Growth
Tax History
| Year | Tax Paid | Tax Assessment Tax Assessment Total Assessment is a certain percentage of the fair market value that is determined by local assessors to be the total taxable value of land and additions on the property. | Land | Improvement |
|---|---|---|---|---|
| 2025 | $2,709 | $88,000 | $0 | $88,000 |
| 2024 | $2,530 | $80,600 | $0 | $80,600 |
| 2023 | $2,530 | $73,100 | $0 | $73,100 |
| 2022 | $2,424 | $66,100 | $0 | $66,100 |
| 2021 | $2,383 | $66,800 | $0 | $66,800 |
| 2020 | $2,356 | $65,200 | $0 | $65,200 |
| 2019 | $2,260 | $62,800 | $0 | $62,800 |
| 2018 | $2,471 | $59,000 | $0 | $59,000 |
| 2017 | $2,372 | $57,000 | $0 | $57,000 |
| 2016 | -- | $54,300 | $0 | $54,300 |
| 2015 | -- | $47,100 | $0 | $0 |
| 2014 | -- | $42,800 | $0 | $0 |
Source: Public Records
Map
Nearby Homes
- 1283 Chartwell Carriage Way N
- 1207 Chartwell Carriage Way S
- 992 Touraine Ave
- 1048 Shelter Ln
- 1017 Coolidge Rd
- 1409 Weatherhill Ct Unit 9
- 728 Audubon Rd
- 1609 Gilcrest Ave
- 615 Glenmoor Rd Unit 2A
- 1412 N Harrison Rd
- 805 Southlawn Ave
- 1418 Chester Rd
- 953 Rosewood Ave
- 1043 Kimberly Dr Unit 11
- 350 Kensington Rd
- 523 Bainbridge Dr Unit 37
- 620 Ardson Rd
- 338 W Saginaw St Unit 48
- 815 Westlawn Ave
- 1610 Autumn Ln
- 1356 Chartwell Carr Way N
- 1352 Chartwell Carr Way N Unit 16
- 1358 Chartwell Carr Way N Unit 13
- 1358 Chartwell Carriage Way N
- 1287 Chartwell Carr Way N Unit 17
- 1336 Chartwell Dual Carr Way
- 1336 Chartwell Dual Carriage Way
- 1342 Chartwell Dual Carr Way
- 1285 Chartwell Carr Way N Unit 18
- 1330 Chartwell Dual Carr Way
- 1308 Chartwell Carriage Way N
- 1388 Chartwell Dual Carr Way
- 1328 Chartwell Carriage Way N Unit 6
- 1328 Chartwell Carriage Way N
- 1283 Chartwell Carr Way N Unit 19
- 1283 Chartwell Carriage Way N Unit 19
- 1372 Chartwell Carriage Way N Unit 4
- 1372 Chartwell Carr Way N
- 1328 Chartwell Carr Way N Unit 6