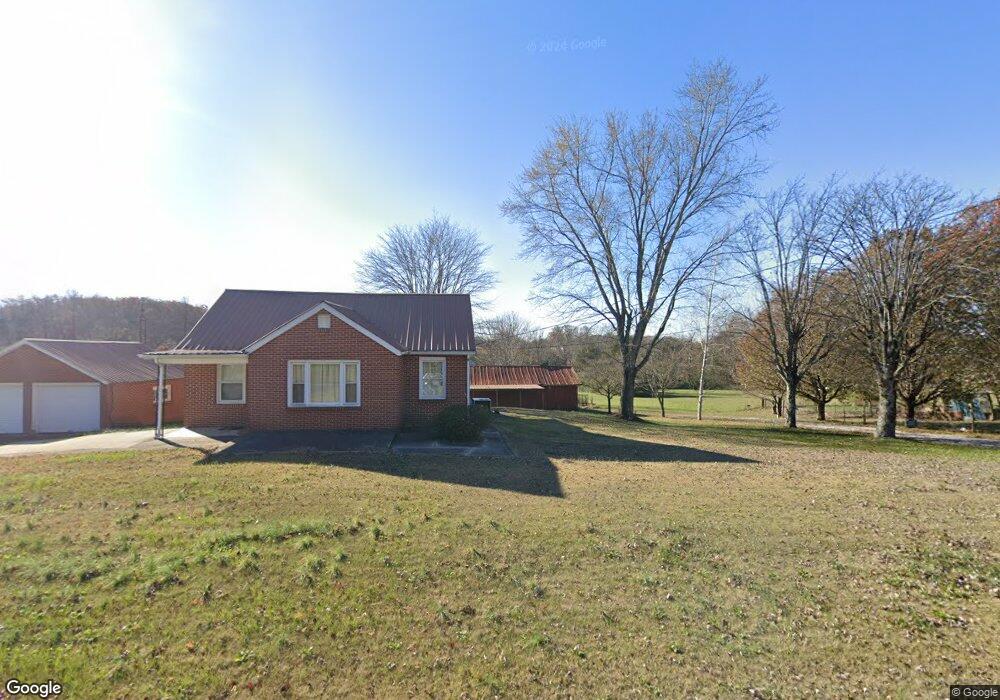
1354 Pippin Rd Cookeville, TN 38501
Estimated Value: $49,000 - $337,000
--
Bed
2
Baths
1,365
Sq Ft
$130/Sq Ft
Est. Value
About This Home
This home is located at 1354 Pippin Rd, Cookeville, TN 38501 and is currently estimated at $177,000, approximately $129 per square foot. 1354 Pippin Rd is a home located in Putnam County with nearby schools including Cane Creek Elementary School, Upperman Middle School, and Upperman High School.
Ownership History
Date
Name
Owned For
Owner Type
Purchase Details
Closed on
Apr 17, 2024
Sold by
Benton Nelson Trust and Nelson Darrell
Bought by
Nelson Darrell
Current Estimated Value
Purchase Details
Closed on
Feb 25, 2016
Sold by
Nelson Benton
Bought by
Nelson Benton Trust and Nelson Benton (Tr)
Purchase Details
Closed on
Apr 13, 2007
Sold by
Benton Nelson
Bought by
Joann Young Shelia
Home Financials for this Owner
Home Financials are based on the most recent Mortgage that was taken out on this home.
Original Mortgage
$50,387
Interest Rate
6.1%
Purchase Details
Closed on
Jun 10, 2002
Sold by
Nelson Darrell E
Bought by
Benton Nelson and Benton Treva
Purchase Details
Closed on
Dec 12, 1994
Sold by
Nelson Benton
Bought by
Wilson John B
Purchase Details
Closed on
Aug 26, 1994
Sold by
Benton Nelson
Bought by
Wilson John B
Purchase Details
Closed on
May 5, 1977
Bought by
Nelson Benton and Treva Jane
Purchase Details
Closed on
Jul 7, 1969
Create a Home Valuation Report for This Property
The Home Valuation Report is an in-depth analysis detailing your home's value as well as a comparison with similar homes in the area
Home Values in the Area
Average Home Value in this Area
Purchase History
| Date | Buyer | Sale Price | Title Company |
|---|---|---|---|
| Nelson Darrell | -- | None Listed On Document | |
| Nelson Darrell | -- | None Listed On Document | |
| Nelson Benton Trust | -- | -- | |
| Joann Young Shelia | $50,000 | -- | |
| Benton Nelson | -- | -- | |
| Wilson John B | -- | -- | |
| Wilson John B | -- | -- | |
| Nelson Benton | -- | -- | |
| -- | -- | -- |
Source: Public Records
Mortgage History
| Date | Status | Borrower | Loan Amount |
|---|---|---|---|
| Previous Owner | Not Available | $50,387 |
Source: Public Records
Tax History Compared to Growth
Tax History
| Year | Tax Paid | Tax Assessment Tax Assessment Total Assessment is a certain percentage of the fair market value that is determined by local assessors to be the total taxable value of land and additions on the property. | Land | Improvement |
|---|---|---|---|---|
| 2024 | $1,127 | $42,375 | $18,150 | $24,225 |
| 2023 | $1,127 | $42,375 | $18,150 | $24,225 |
| 2022 | $1,048 | $42,375 | $18,150 | $24,225 |
| 2021 | $1,048 | $42,375 | $18,150 | $24,225 |
| 2020 | $1,009 | $42,375 | $18,150 | $24,225 |
| 2019 | $982 | $37,325 | $18,150 | $19,175 |
| 2018 | $917 | $33,575 | $18,150 | $15,425 |
| 2017 | $917 | $33,575 | $18,150 | $15,425 |
| 2016 | $917 | $33,575 | $18,150 | $15,425 |
| 2015 | $971 | $34,625 | $18,150 | $16,475 |
| 2014 | $773 | $27,550 | $0 | $0 |
Source: Public Records
Map
Nearby Homes
- 553 County Farm Rd
- 2136 W Broad St
- 1957 W Broad St
- 0 Corner of W Broad St & Tn Ave Unit RTC2794105
- 1475 Dyer Creek Rd
- 2.52 St
- Lot 3 Miller
- 270 Locust Grove Rd
- 2300 Sun Valley Cir
- 279 Willow Brook Dr
- 2911 Grand Ridge Dr
- 2.52 ac W Broad St
- 500 N McBroom Chapel Rd
- 3030 Westowne Cir
- 3022 Westowne Cir
- 3180 Westowne Cir
- 2269 Plunk Whitson Rd
- 3134 Westowne Cir
- 1711 Creekside Dr
- 1775 Creekside Dr