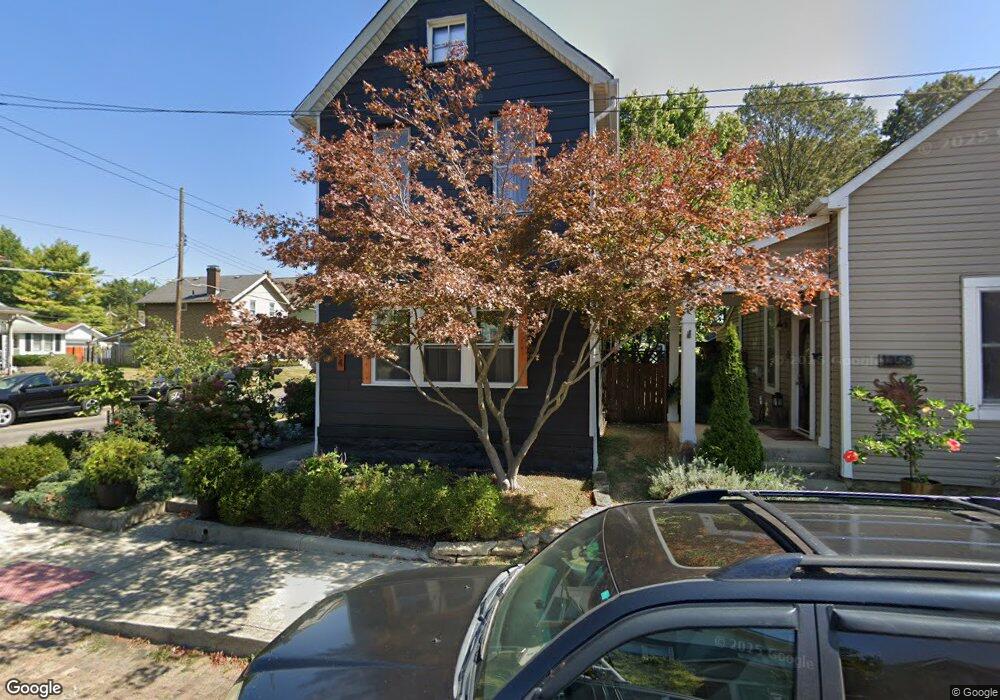
1354 S 5th St Columbus, OH 43207
Merion Village NeighborhoodEstimated Value: $324,454 - $432,000
3
Beds
1
Bath
1,664
Sq Ft
$233/Sq Ft
Est. Value
About This Home
This home is located at 1354 S 5th St, Columbus, OH 43207 and is currently estimated at $387,364, approximately $232 per square foot. 1354 S 5th St is a home located in Franklin County with nearby schools including Southwood Elementary School, South High School, and South Columbus Preparatory Academy.
Ownership History
Date
Name
Owned For
Owner Type
Purchase Details
Closed on
Oct 22, 2001
Sold by
Sec Of Hud
Bought by
Phillips John G and Phillips Jurate
Current Estimated Value
Home Financials for this Owner
Home Financials are based on the most recent Mortgage that was taken out on this home.
Original Mortgage
$34,175
Outstanding Balance
$13,289
Interest Rate
6.8%
Estimated Equity
$374,075
Purchase Details
Closed on
Nov 22, 2000
Sold by
Dietz Kimberly S and Norwest Mtg Inc
Bought by
Hud
Purchase Details
Closed on
Oct 29, 1997
Sold by
Wilson Ruth E
Bought by
Dietz Kimberly S and Ranson Richard C
Home Financials for this Owner
Home Financials are based on the most recent Mortgage that was taken out on this home.
Original Mortgage
$60,941
Interest Rate
7.42%
Mortgage Type
FHA
Create a Home Valuation Report for This Property
The Home Valuation Report is an in-depth analysis detailing your home's value as well as a comparison with similar homes in the area
Home Values in the Area
Average Home Value in this Area
Purchase History
| Date | Buyer | Sale Price | Title Company |
|---|---|---|---|
| Phillips John G | $46,500 | Contract Processing & Title | |
| Hud | $44,600 | -- | |
| Dietz Kimberly S | $61,000 | Chicago Title |
Source: Public Records
Mortgage History
| Date | Status | Borrower | Loan Amount |
|---|---|---|---|
| Open | Phillips John G | $34,175 | |
| Previous Owner | Dietz Kimberly S | $60,941 |
Source: Public Records
Tax History Compared to Growth
Tax History
| Year | Tax Paid | Tax Assessment Tax Assessment Total Assessment is a certain percentage of the fair market value that is determined by local assessors to be the total taxable value of land and additions on the property. | Land | Improvement |
|---|---|---|---|---|
| 2024 | $4,719 | $105,150 | $42,600 | $62,550 |
| 2023 | $4,659 | $105,150 | $42,600 | $62,550 |
| 2022 | $2,938 | $56,640 | $12,920 | $43,720 |
| 2021 | $3,037 | $56,640 | $12,920 | $43,720 |
| 2020 | $2,947 | $56,640 | $12,920 | $43,720 |
| 2019 | $2,374 | $39,140 | $9,560 | $29,580 |
| 2018 | $2,409 | $39,140 | $9,560 | $29,580 |
| 2017 | $2,373 | $39,140 | $9,560 | $29,580 |
| 2016 | $2,697 | $40,710 | $7,880 | $32,830 |
| 2015 | $2,448 | $40,710 | $7,880 | $32,830 |
| 2014 | $2,524 | $40,710 | $7,880 | $32,830 |
| 2013 | $1,295 | $40,705 | $7,875 | $32,830 |
Source: Public Records
Map
Nearby Homes
- 165 Frebis Ave
- 1374 S 5th St
- 164 Frebis Ave
- 1366 S 4th St
- 1272 S 4th St
- 1420 S 4th St
- 65 Frebis Ave
- 154-156 E Gates St
- 1452 S 4th St
- 130 E Gates St
- 325 Frebis Ave
- 195 E Mithoff St Unit 195
- 1357 City Park Ave Unit 359
- 348-350 E Moler St
- 109 E Mithoff St
- 144 E Mithoff St
- 1264 S High St
- 1218 Bruck St
- 6 Hanford St Unit 6
- 320 E Mithoff St
- 1358 S 5th St
- 1362 S 5th St
- 1366 S 5th St
- 1370 S 5th St
- 178 E Moler St
- 182 E Moler St
- 174 E Moler St
- 186 E Moler St Unit 188
- 170 E Moler St
- 195 E Moler St
- 195 E Moler St
- 195 E Moler St Unit Rear
- 197 E Moler St
- 195 E Moler St
- 196 E Moler St
- 1378 S 5th St
- 1351 S 5th St
- 1357 S 5th St
- 1359 S 5th St
- 201 E Moler St