
Seller's Agent in 2020
Shawn Langan
NAI Ruhl Commercial Company
(563) 823-5118
99 Total Sales

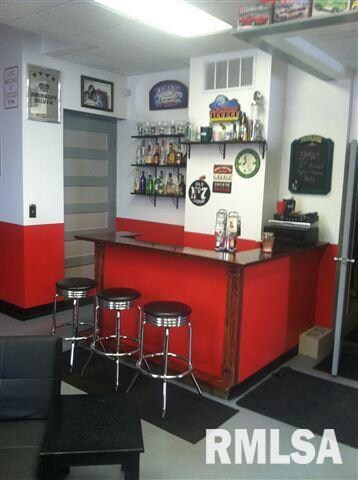

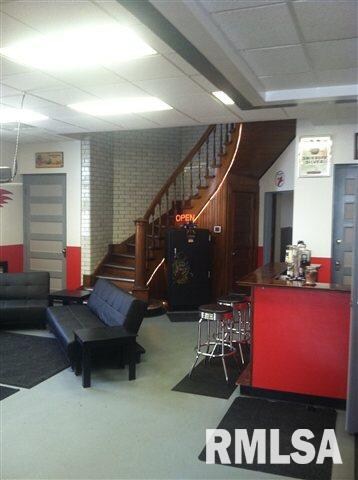
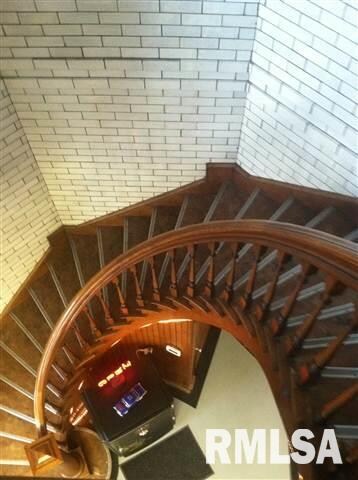
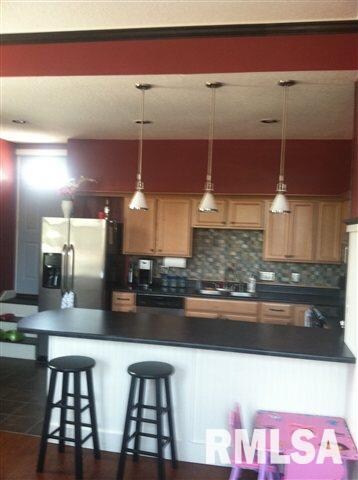
Originally Fire Station #8 located on the corner of 4th Street & Fillmore in W Davenport. Entire building has been totally renovated. Currently the 1st level is an auto body shop with 2 private offices and waiting area. Upper level has been converted to a beautiful 1500 SF loft with all the updates including wood floors, tiled kitchen with center island, jacuzzi tub and much more. Many uses for this space, can be zoned residential.
Last Agent to Sell the Property
Meg Halligan
NAI Ruhl Commercial Company License #S61135000/475.126530 Listed on: 07/23/2012
Last Buyer's Agent
Meg Halligan
NAI Ruhl Commercial Company License #S61135000/475.126530 Listed on: 07/23/2012
| Date | Type | Sale Price | Title Company |
|---|---|---|---|
| Warranty Deed | $175,000 | None Available | |
| Contract Of Sale | $91,500 | None Available |
| Date | Status | Loan Amount | Loan Type |
|---|---|---|---|
| Open | $137,500 | Commercial | |
| Previous Owner | $76,500 | Seller Take Back |
| Date | Event | Price | Change | Sq Ft Price |
|---|---|---|---|---|
| 06/30/2020 06/30/20 | Rented | $240,000 | -14.0% | -- |
| 05/27/2020 05/27/20 | Under Contract | -- | -- | -- |
| 08/01/2019 08/01/19 | For Rent | $279,000 | +150.0% | -- |
| 02/13/2018 02/13/18 | Rented | $111,600 | 0.0% | -- |
| 01/24/2018 01/24/18 | Under Contract | -- | -- | -- |
| 09/07/2017 09/07/17 | For Rent | $111,600 | +87.6% | -- |
| 12/16/2013 12/16/13 | Rented | $59,500 | 0.0% | -- |
| 11/19/2013 11/19/13 | Under Contract | -- | -- | -- |
| 01/25/2013 01/25/13 | For Rent | $59,500 | 0.0% | -- |
| 01/17/2013 01/17/13 | Sold | $175,000 | -16.7% | $114 / Sq Ft |
| 11/09/2012 11/09/12 | Pending | -- | -- | -- |
| 07/23/2012 07/23/12 | For Sale | $210,000 | -- | $137 / Sq Ft |
| Year | Tax Paid | Tax Assessment Tax Assessment Total Assessment is a certain percentage of the fair market value that is determined by local assessors to be the total taxable value of land and additions on the property. | Land | Improvement |
|---|---|---|---|---|
| 2024 | $5,622 | $277,750 | $10,910 | $266,840 |
| 2023 | $3,828 | $277,750 | $10,910 | $266,840 |
| 2022 | $4,171 | $179,180 | $10,910 | $168,270 |
| 2021 | $4,042 | $179,180 | $10,910 | $168,270 |
| 2020 | $3,912 | $159,010 | $10,910 | $148,100 |
| 2019 | $3,625 | $145,540 | $10,910 | $134,630 |
| 2018 | $3,873 | $145,540 | $10,910 | $134,630 |
| 2017 | $3,547 | $145,540 | $10,910 | $134,630 |
| 2016 | $3,487 | $121,200 | $0 | $0 |
| 2015 | $3,118 | $121,200 | $0 | $0 |
| 2014 | $2,692 | $121,200 | $0 | $0 |
| 2013 | $3,650 | $0 | $0 | $0 |
| 2012 | -- | $121,200 | $15,600 | $105,600 |
Seller's Agent in 2020
Shawn Langan
NAI Ruhl Commercial Company
(563) 823-5118
99 Total Sales
Buyer Co-Listing Agent in 2020
Pete Hadjis
NAI Ruhl Commercial Company
(563) 484-4151
89 Total Sales
M
Seller's Agent in 2013
Meg Halligan
NAI Ruhl Commercial Company
Source: RMLS Alliance
MLS Number: RMAQC7027708
APN: K0008-35A
Disclaimer: Certain information contained herein is derived from information provided by parties other than Homes.com. All information provided is deemed reliable, but is not guaranteed to be accurate and should be independently verified.
![]() IDX information is provided exclusively for personal, non-commercial use, and may not be used for any purpose other than to identify prospective properties consumers may be interested in purchasing. Information is deemed reliable but not guaranteed.
IDX information is provided exclusively for personal, non-commercial use, and may not be used for any purpose other than to identify prospective properties consumers may be interested in purchasing. Information is deemed reliable but not guaranteed.