13548 170th St Linwood, KS 66052
Estimated Value: $497,918 - $584,000
4
Beds
4
Baths
1,514
Sq Ft
$357/Sq Ft
Est. Value
About This Home
This home is located at 13548 170th St, Linwood, KS 66052 and is currently estimated at $540,639, approximately $357 per square foot. 13548 170th St is a home located in Leavenworth County with nearby schools including Linwood Elementary School, Basehor-Linwood Middle School, and Basehor-Linwood High School.
Ownership History
Date
Name
Owned For
Owner Type
Purchase Details
Closed on
Nov 20, 2023
Sold by
Michael Fisher And Jocile Fisher Living
Bought by
Fisher Michael F and Fisher Josephine L
Current Estimated Value
Home Financials for this Owner
Home Financials are based on the most recent Mortgage that was taken out on this home.
Original Mortgage
$738,000
Outstanding Balance
$507,883
Interest Rate
6%
Mortgage Type
Reverse Mortgage Home Equity Conversion Mortgage
Estimated Equity
$32,756
Purchase Details
Closed on
Nov 14, 2023
Sold by
Michael Fisher And Jocile Fisher Living and Fisher Michael
Bought by
Fisher Michael F and Fisher Josephine L
Home Financials for this Owner
Home Financials are based on the most recent Mortgage that was taken out on this home.
Original Mortgage
$738,000
Outstanding Balance
$507,883
Interest Rate
6%
Mortgage Type
Reverse Mortgage Home Equity Conversion Mortgage
Estimated Equity
$32,756
Purchase Details
Closed on
May 1, 1993
Bought by
Fisher Michael F and Fisher Jocile
Create a Home Valuation Report for This Property
The Home Valuation Report is an in-depth analysis detailing your home's value as well as a comparison with similar homes in the area
Home Values in the Area
Average Home Value in this Area
Purchase History
| Date | Buyer | Sale Price | Title Company |
|---|---|---|---|
| Fisher Michael F | -- | Security 1St Title | |
| Fisher Michael F | -- | Security 1St Title | |
| Fisher Michael F | $17,500 | -- |
Source: Public Records
Mortgage History
| Date | Status | Borrower | Loan Amount |
|---|---|---|---|
| Open | Fisher Michael F | $738,000 | |
| Closed | Fisher Michael F | $738,000 | |
| Closed | Fisher Michael F | $738,000 | |
| Closed | Fisher Michael F | $738,000 |
Source: Public Records
Tax History Compared to Growth
Tax History
| Year | Tax Paid | Tax Assessment Tax Assessment Total Assessment is a certain percentage of the fair market value that is determined by local assessors to be the total taxable value of land and additions on the property. | Land | Improvement |
|---|---|---|---|---|
| 2025 | $5,280 | $47,877 | $9,157 | $38,720 |
| 2024 | $4,814 | $46,684 | $9,153 | $37,531 |
| 2023 | $4,814 | $44,776 | $8,572 | $36,204 |
| 2022 | $4,511 | $40,222 | $7,202 | $33,020 |
| 2021 | $3,806 | $34,097 | $5,830 | $28,267 |
| 2020 | $3,826 | $33,519 | $5,611 | $27,908 |
| 2019 | $3,730 | $32,475 | $5,030 | $27,445 |
| 2018 | $3,293 | $28,691 | $3,865 | $24,826 |
| 2017 | $2,991 | $26,049 | $3,856 | $22,193 |
| 2016 | $2,879 | $25,018 | $3,812 | $21,206 |
| 2015 | $2,784 | $24,267 | $3,066 | $21,201 |
| 2014 | $2,589 | $22,662 | $3,057 | $19,605 |
Source: Public Records
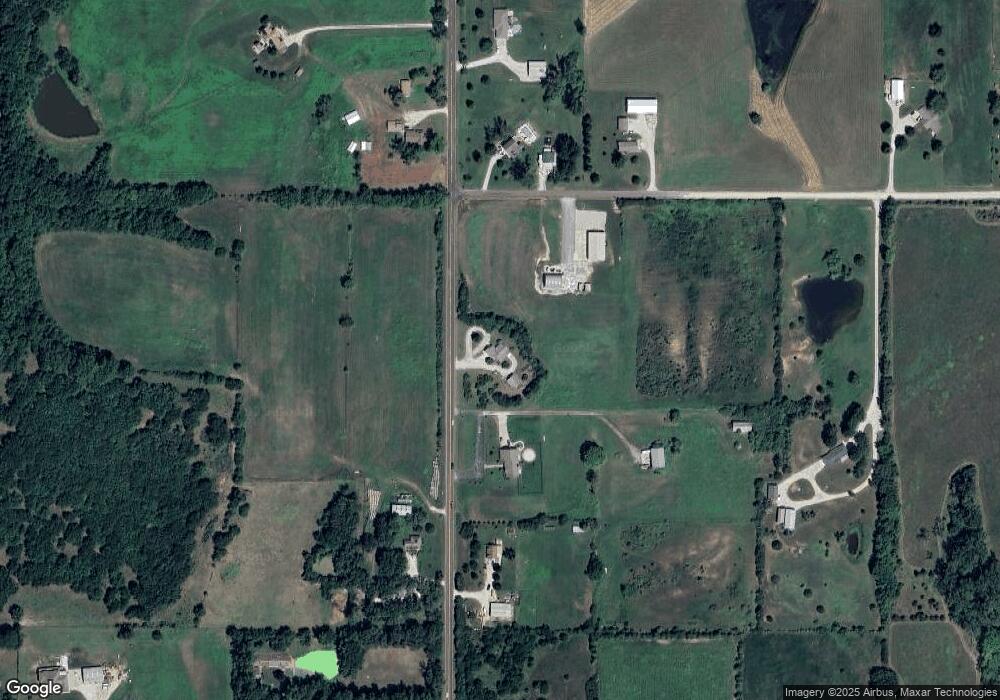
Map
Nearby Homes
- 0 174th St
- 0 Cantrell & 174th St
- 17580 Cantrell Rd
- 14587 166th St
- 13525 N 158th St
- 14714 174th St
- 14425 158th St
- 6.20 Acres 182nd St
- 18261 Linwood Rd
- 15514 Loring Rd
- 13348 185th St
- 13519 185th St
- 00000 Lot 3 South Stillwell Rd
- 00000 Lot 4 South Stillwell Rd
- 00000 Lot 2 South Stillwell Rd
- 00000 Lot 5 South Stillwell Rd
- 00000 Lot 7 South Stillwell Rd
- 18494 Linwood Rd
- Parcel 5A SE Stanley Rd
- Parcel 3A SE Stanley Rd
- 13460 170th St
- 13419 170th St
- 16964 Kreider Rd
- 13643 170th St
- 13420 170th St
- 16904 Kreider Rd
- 13650 170th St
- 13361 170th St
- 13657 170th St
- 16811 Kreider Rd
- 13748 170th St
- 13758 170th St
- 17000 Morning Deer Rd
- 16804 Kreider Rd
- 17256 Morning Deer Rd
- 17100 Morning Deer Rd
- 16734 Kreider Rd
- 13787 170th St
- 17043 Morning Deer Rd
- 13768 170th St