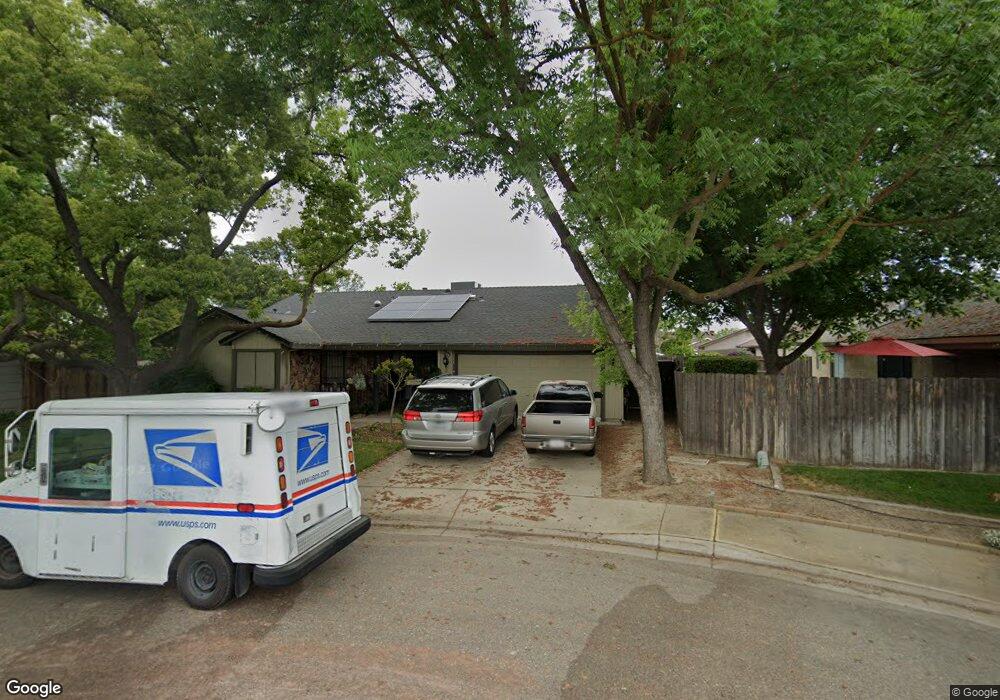
1355 Nathan Ct Turlock, CA 95380
Estimated Value: $358,000 - $444,000
3
Beds
2
Baths
1,240
Sq Ft
$328/Sq Ft
Est. Value
About This Home
This home is located at 1355 Nathan Ct, Turlock, CA 95380 and is currently estimated at $406,378, approximately $327 per square foot. 1355 Nathan Ct is a home located in Stanislaus County with nearby schools including Crowell Elementary School, Marvin A. Dutcher Middle School, and Turlock Junior High School.
Ownership History
Date
Name
Owned For
Owner Type
Purchase Details
Closed on
Nov 16, 2016
Sold by
Kendall John and Kendall Sheila
Bought by
Kendall John and Kendall Sheila
Current Estimated Value
Purchase Details
Closed on
Nov 13, 2001
Sold by
Kendall John and Kendall Sheila
Bought by
Kendall John and Kendall Sheila
Purchase Details
Closed on
Oct 21, 1999
Sold by
Hud
Bought by
Kendall John T and Kendall Sheila M
Home Financials for this Owner
Home Financials are based on the most recent Mortgage that was taken out on this home.
Original Mortgage
$108,717
Outstanding Balance
$32,901
Interest Rate
7.86%
Mortgage Type
FHA
Estimated Equity
$373,477
Purchase Details
Closed on
Jul 13, 1999
Sold by
Amboy Mariano A and Amboy Sheila M
Bought by
Mission Hills Mtg Corp
Create a Home Valuation Report for This Property
The Home Valuation Report is an in-depth analysis detailing your home's value as well as a comparison with similar homes in the area
Purchase History
| Date | Buyer | Sale Price | Title Company |
|---|---|---|---|
| Kendall John | -- | None Available | |
| Kendall John | -- | -- | |
| Kendall John T | $105,000 | North American Title Co | |
| Mission Hills Mtg Corp | $126,697 | Fidelity National Title Ins |
Source: Public Records
Mortgage History
| Date | Status | Borrower | Loan Amount |
|---|---|---|---|
| Open | Kendall John T | $108,717 |
Source: Public Records
Tax History
| Year | Tax Paid | Tax Assessment Tax Assessment Total Assessment is a certain percentage of the fair market value that is determined by local assessors to be the total taxable value of land and additions on the property. | Land | Improvement |
|---|---|---|---|---|
| 2025 | $1,715 | $166,614 | $46,096 | $120,518 |
| 2024 | $1,682 | $163,348 | $45,193 | $118,155 |
| 2023 | $1,678 | $160,146 | $44,307 | $115,839 |
| 2022 | $1,655 | $157,007 | $43,439 | $113,568 |
| 2021 | $1,629 | $153,930 | $42,588 | $111,342 |
| 2020 | $1,617 | $152,353 | $42,152 | $110,201 |
| 2019 | $1,589 | $149,367 | $41,326 | $108,041 |
| 2018 | $1,586 | $146,439 | $40,516 | $105,923 |
| 2017 | $1,547 | $143,569 | $39,722 | $103,847 |
| 2016 | $1,444 | $140,755 | $38,944 | $101,811 |
| 2015 | $1,430 | $138,642 | $38,360 | $100,282 |
| 2014 | $1,414 | $135,927 | $37,609 | $98,318 |
Source: Public Records
Map
Nearby Homes
- 2450 Fulkerth Rd
- 2400 Fulkerth Rd
- 2230 Aspenwood Dr
- 961 Countryside Dr
- 2098 Joett Dr
- 2631 Polous Dr
- 2065 Cody Ct
- 1400 N Tully Rd Unit 120
- 1400 N Tully Rd Unit 91
- 1400 N Tully Rd Unit 168
- 990 Shawnan Dr
- 1330 Dianne Dr
- 500 N Tully Rd Unit 39
- 500 N Tully Rd
- 2175 W Main St
- 2147 Sorrel Dr
- 1249 Magic Sands Way
- 1253 Magic Sands Way
- 3000 W Tuolumne Rd
- 200 N Tully Rd
- 1305 Nathan Ct
- 1300 Countryside Dr
- 2400 Branding Iron Dr
- 1250 Countryside Dr
- 2450 Branding Iron Dr
- 2405 Mayfaire Dr
- 2395 Mayfaire Dr
- 1300 Nathan Ct
- 2455 Mayfaire Dr
- 1350 Nathan Ct
- 2365 Mayfaire Dr
- 2350 Branding Iron Dr
- 2401 Branding Iron Dr
- 2305 Mayfaire Dr
- 2451 Branding Iron Dr
- 1351 Brent Ct
- 1255 Countryside Dr
- 1225 Countryside Dr
- 1305 Countryside Dr
- 2400 Mayfaire Dr
Your Personal Tour Guide
Ask me questions while you tour the home.