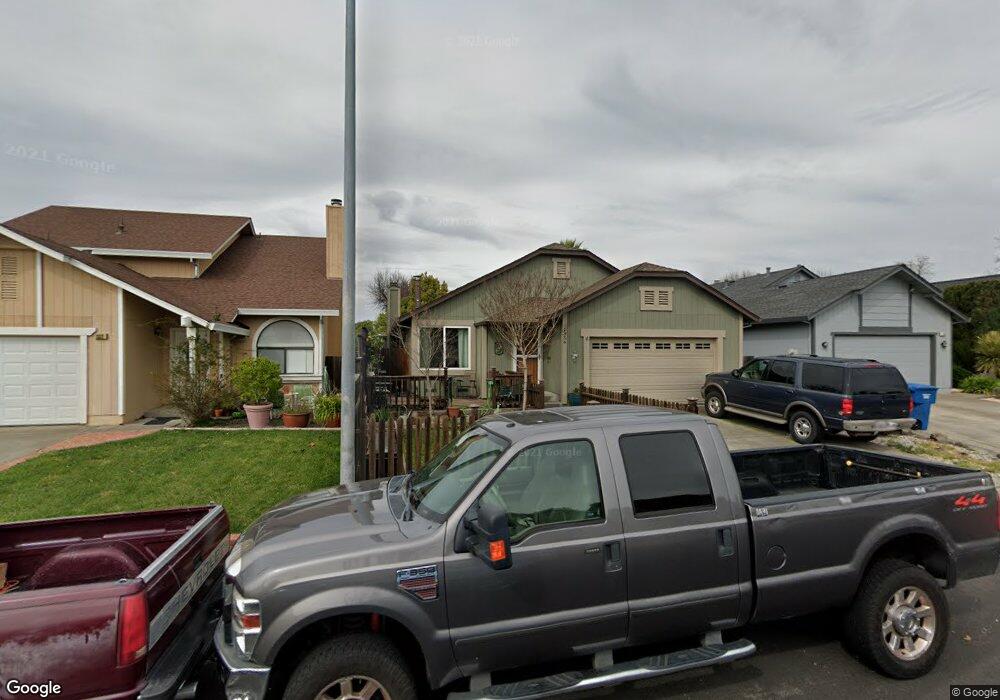
1356 Middlebrook Way Rohnert Park, CA 94928
Estimated Value: $723,000 - $743,313
3
Beds
2
Baths
1,442
Sq Ft
$510/Sq Ft
Est. Value
About This Home
This home is located at 1356 Middlebrook Way, Rohnert Park, CA 94928 and is currently estimated at $735,078, approximately $509 per square foot. 1356 Middlebrook Way is a home located in Sonoma County with nearby schools including Rancho Cotate High School, Credo High School, and Cross & Crown Lutheran School.
Ownership History
Date
Name
Owned For
Owner Type
Purchase Details
Closed on
Aug 19, 1998
Sold by
Dengler Martin and Dengler Elaine M
Bought by
Guthrie David N and Guthrie Teri M
Current Estimated Value
Home Financials for this Owner
Home Financials are based on the most recent Mortgage that was taken out on this home.
Original Mortgage
$186,000
Outstanding Balance
$38,668
Interest Rate
6.88%
Estimated Equity
$696,410
Purchase Details
Closed on
Jan 31, 1996
Sold by
Dengler Martin and Dengler Elaine M
Bought by
Dengler Martin and Dengler Elaine M
Home Financials for this Owner
Home Financials are based on the most recent Mortgage that was taken out on this home.
Original Mortgage
$78,000
Interest Rate
7.38%
Purchase Details
Closed on
Dec 4, 1995
Sold by
Dengler Martin and Dengler Elaine M
Bought by
Dengler Martin and Dengler Elaine M
Home Financials for this Owner
Home Financials are based on the most recent Mortgage that was taken out on this home.
Original Mortgage
$78,000
Interest Rate
7.38%
Create a Home Valuation Report for This Property
The Home Valuation Report is an in-depth analysis detailing your home's value as well as a comparison with similar homes in the area
Home Values in the Area
Average Home Value in this Area
Purchase History
| Date | Buyer | Sale Price | Title Company |
|---|---|---|---|
| Guthrie David N | $210,500 | First American Title | |
| Dengler Martin | -- | North Bay Title Co | |
| Dengler Martin | -- | North Bay Title Co |
Source: Public Records
Mortgage History
| Date | Status | Borrower | Loan Amount |
|---|---|---|---|
| Open | Guthrie David N | $186,000 | |
| Previous Owner | Dengler Martin | $78,000 |
Source: Public Records
Tax History Compared to Growth
Tax History
| Year | Tax Paid | Tax Assessment Tax Assessment Total Assessment is a certain percentage of the fair market value that is determined by local assessors to be the total taxable value of land and additions on the property. | Land | Improvement |
|---|---|---|---|---|
| 2025 | $3,967 | $343,033 | $130,115 | $212,918 |
| 2024 | $3,967 | $336,308 | $127,564 | $208,744 |
| 2023 | $3,967 | $329,714 | $125,063 | $204,651 |
| 2022 | $3,890 | $323,250 | $122,611 | $200,639 |
| 2021 | $3,858 | $316,912 | $120,207 | $196,705 |
| 2020 | $3,914 | $313,664 | $118,975 | $194,689 |
| 2019 | $3,863 | $307,515 | $116,643 | $190,872 |
| 2018 | $3,789 | $301,486 | $114,356 | $187,130 |
| 2017 | $3,726 | $295,575 | $112,114 | $183,461 |
| 2016 | $3,570 | $289,780 | $109,916 | $179,864 |
| 2015 | $3,484 | $285,428 | $108,265 | $177,163 |
| 2014 | $3,459 | $279,838 | $106,145 | $173,693 |
Source: Public Records
Map
Nearby Homes
- 7645 Camino Colegio
- 7767 Camino Colegio Unit 29
- 8201 Camino Colegio Unit 122
- 8201 Camino Colegio Unit 11
- 8201 Camino Colegio Unit 120
- 8201 Camino Colegio Unit 221
- 8201 Camino Colegio Unit 158
- 8006 Manor Ct
- 1214 Marque Dr
- 1217 Mateo Dr
- 7134 Carillon Ct
- 8140 Sunflower Dr
- 7006 Santero Way
- 9005 Camino Colegio
- 9013 Camino Colegio
- 1252 Waldorf Ln
- 9021 Camino Colegio
- 9029 Camino Colegio
- 9037 Camino Colegio
- 1328 Waldorf Ln
- 1360 Middlebrook Way
- 1352 Middlebrook Way
- 1364 Middlebrook Way
- 1348 Middlebrook Way
- 7552 Mercedes Way
- 7551 Monet Place
- 7547 Monet Place
- 7548 Mercedes Way
- 1355 Middlebrook Way
- 1359 Middlebrook Way
- 1351 Middlebrook Way
- 7544 Mercedes Way
- 1363 Middlebrook Way
- 7550 Monet Place
- 1372 Middlebrook Way
- 1347 Middlebrook Way
- 7543 Monet Place
- 1340 Middlebrook Way
- 1367 Middlebrook Way
- 1343 Middlebrook Way