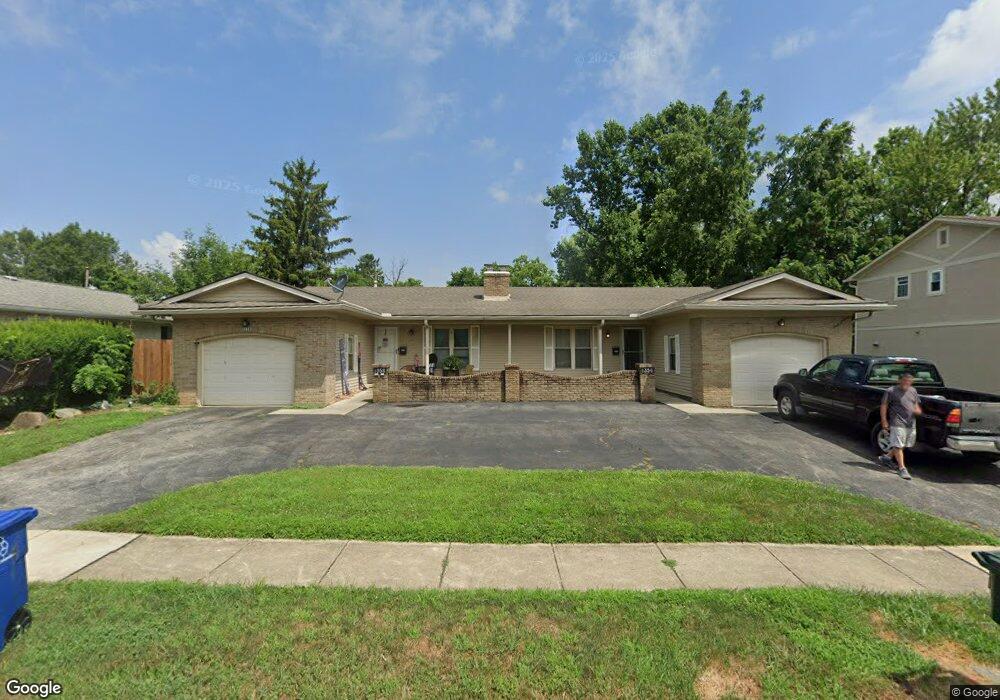
1356 Weybridge Rd Unit 358 Columbus, OH 43220
Knolls West NeighborhoodEstimated Value: $429,568 - $468,000
5
Beds
3
Baths
2,188
Sq Ft
$208/Sq Ft
Est. Value
About This Home
This home is located at 1356 Weybridge Rd Unit 358, Columbus, OH 43220 and is currently estimated at $454,642, approximately $207 per square foot. 1356 Weybridge Rd Unit 358 is a home located in Franklin County with nearby schools including Winterset Elementary School, Ridgeview Middle School, and Centennial High School.
Ownership History
Date
Name
Owned For
Owner Type
Purchase Details
Closed on
Feb 18, 2022
Sold by
Dandrea Joseph J
Bought by
Showe Diandra and Dandrea Wade A
Current Estimated Value
Home Financials for this Owner
Home Financials are based on the most recent Mortgage that was taken out on this home.
Original Mortgage
$288,000
Outstanding Balance
$267,430
Interest Rate
3.55%
Mortgage Type
New Conventional
Estimated Equity
$187,212
Purchase Details
Closed on
Aug 2, 1996
Sold by
Lewis Marilyn Jean
Bought by
D'Andrea Joseph J and D'Andrea Sandra A
Home Financials for this Owner
Home Financials are based on the most recent Mortgage that was taken out on this home.
Original Mortgage
$92,300
Interest Rate
8.33%
Mortgage Type
New Conventional
Create a Home Valuation Report for This Property
The Home Valuation Report is an in-depth analysis detailing your home's value as well as a comparison with similar homes in the area
Home Values in the Area
Average Home Value in this Area
Purchase History
| Date | Buyer | Sale Price | Title Company |
|---|---|---|---|
| Showe Diandra | $360,000 | Search2close | |
| D'Andrea Joseph J | $134,000 | -- |
Source: Public Records
Mortgage History
| Date | Status | Borrower | Loan Amount |
|---|---|---|---|
| Open | Showe Diandra | $288,000 | |
| Previous Owner | D'Andrea Joseph J | $92,300 |
Source: Public Records
Tax History Compared to Growth
Tax History
| Year | Tax Paid | Tax Assessment Tax Assessment Total Assessment is a certain percentage of the fair market value that is determined by local assessors to be the total taxable value of land and additions on the property. | Land | Improvement |
|---|---|---|---|---|
| 2024 | $5,496 | $121,170 | $44,870 | $76,300 |
| 2023 | $5,426 | $121,170 | $44,870 | $76,300 |
| 2022 | $4,507 | $84,810 | $19,500 | $65,310 |
| 2021 | $4,665 | $84,810 | $19,500 | $65,310 |
| 2020 | $4,522 | $84,810 | $19,500 | $65,310 |
| 2019 | $4,220 | $67,870 | $15,610 | $52,260 |
| 2018 | $4,155 | $67,870 | $15,610 | $52,260 |
| 2017 | $4,359 | $67,870 | $15,610 | $52,260 |
| 2016 | $4,500 | $66,230 | $13,830 | $52,400 |
| 2015 | $4,096 | $66,230 | $13,830 | $52,400 |
| 2014 | $4,106 | $66,230 | $13,830 | $52,400 |
| 2013 | $1,979 | $63,070 | $13,160 | $49,910 |
Source: Public Records
Map
Nearby Homes
- 1466 Weybridge Rd
- 4818 -4820 Winterset Dr
- 1558 Denbigh Dr
- 4710 Charecote Ln Unit D
- 1147 Langland Dr
- 4543 Ducrest Dr
- 1161 Bethel Rd Unit 103/104
- 5111 Portland St
- 1046 Merrimar Cir N Unit B
- 1030 Galliton Ct Unit B
- 5111 Schuylkill St
- 4924 Reed Rd Unit B
- 1739 Paula Dr Unit 1739
- 1297 Slade Ave
- 1284 Slade Ave
- 1512 Lafayette Dr Unit B
- 1033 Folkestone Rd
- 1835 Willoway Cir N
- 1594 Lafayette Dr Unit 1594
- 1213 Nantucket Ave
- 1340 Weybridge Rd Unit 342
- 1340 Weybridge Rd Unit 1340 & 1342
- 1364 Weybridge Rd Unit 366
- 1328 Weybridge Rd Unit 330
- 1374 Weybridge Rd Unit 376
- 1320 Weybridge Rd Unit 322
- 1309 Francisco Rd
- 1396 Weybridge Rd
- 1394-1396 Weybridge Rd
- 1299 Francisco Rd
- 1394 Weybridge Rd Unit 396
- 1312 Weybridge Rd Unit 314
- 1395 Weybridge Rd Unit 397
- 1304 Weybridge Rd Unit 306
- 1361 Francisco Rd
- 1406-1408 Weybridge Rd
- 1406 Weybridge Rd Unit 408
- 1273 Francisco Rd
- 1405 Weybridge Rd Unit 407
- 1407 Weybridge Rd