Estimated Value: $849,780 - $877,000
4
Beds
3
Baths
1,871
Sq Ft
$459/Sq Ft
Est. Value
About This Home
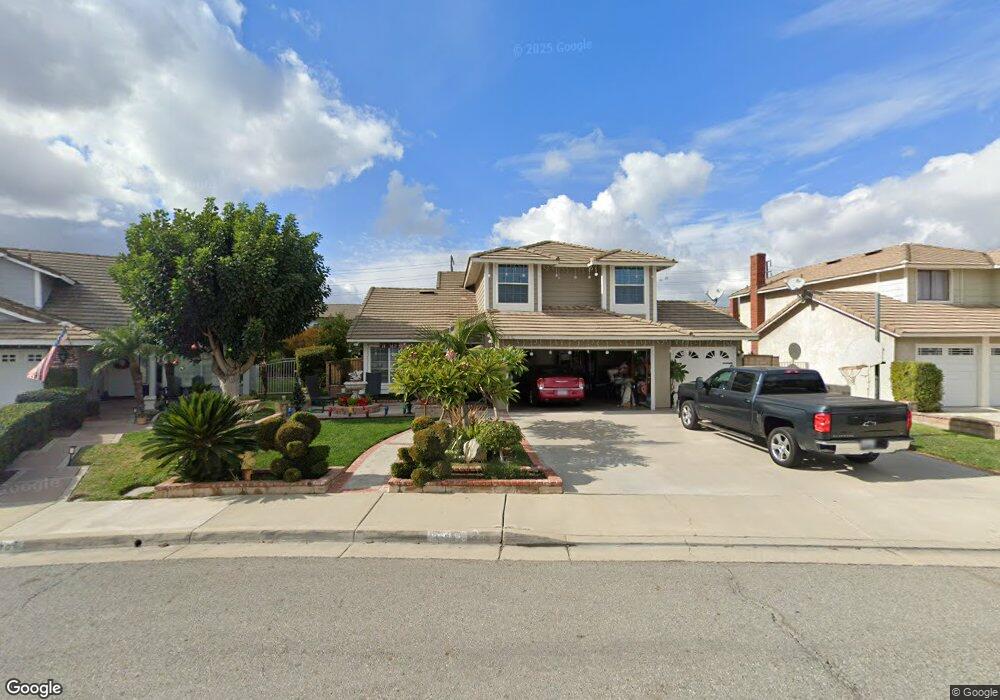
This home is located at 13568 Devonshire Ln, Chino, CA 91710 and is currently estimated at $859,195, approximately $459 per square foot. 13568 Devonshire Ln is a home located in San Bernardino County with nearby schools including Howard Cattle Elementary, Magnolia Junior High, and Chino High School.
Ownership History
Date
Name
Owned For
Owner Type
Purchase Details
Closed on
Feb 25, 2019
Sold by
Huisar Joe L and Huisar Irene
Bought by
The Huisar Living Trust
Current Estimated Value
Purchase Details
Closed on
Aug 7, 2003
Sold by
Huisar Joe L and Huisar Irene
Bought by
Huisar Joe L and Huisar Irene
Home Financials for this Owner
Home Financials are based on the most recent Mortgage that was taken out on this home.
Original Mortgage
$170,000
Interest Rate
5.29%
Mortgage Type
Purchase Money Mortgage
Purchase Details
Closed on
Aug 16, 1993
Sold by
Houser Gary E and Houser Debra J
Bought by
Huisar Joe L and Huisar Irene
Home Financials for this Owner
Home Financials are based on the most recent Mortgage that was taken out on this home.
Original Mortgage
$144,000
Interest Rate
7.25%
Create a Home Valuation Report for This Property
The Home Valuation Report is an in-depth analysis detailing your home's value as well as a comparison with similar homes in the area
Home Values in the Area
Average Home Value in this Area
Purchase History
| Date | Buyer | Sale Price | Title Company |
|---|---|---|---|
| The Huisar Living Trust | -- | None Available | |
| Huisar Joe L | -- | American Title | |
| Huisar Joe L | $180,000 | Chicago Title Co |
Source: Public Records
Mortgage History
| Date | Status | Borrower | Loan Amount |
|---|---|---|---|
| Closed | Huisar Joe L | $170,000 | |
| Closed | Huisar Joe L | $144,000 |
Source: Public Records
Tax History
| Year | Tax Paid | Tax Assessment Tax Assessment Total Assessment is a certain percentage of the fair market value that is determined by local assessors to be the total taxable value of land and additions on the property. | Land | Improvement |
|---|---|---|---|---|
| 2025 | $3,365 | $305,942 | $76,485 | $229,457 |
| 2024 | $3,274 | $299,943 | $74,985 | $224,958 |
| 2023 | $3,182 | $294,062 | $73,515 | $220,547 |
| 2022 | $3,161 | $288,297 | $72,074 | $216,223 |
| 2021 | $3,098 | $282,644 | $70,661 | $211,983 |
| 2020 | $3,056 | $279,745 | $69,936 | $209,809 |
| 2019 | $3,001 | $274,260 | $68,565 | $205,695 |
| 2018 | $2,933 | $268,883 | $67,221 | $201,662 |
| 2017 | $2,879 | $263,611 | $65,903 | $197,708 |
| 2016 | $2,690 | $258,442 | $64,611 | $193,831 |
| 2015 | $2,635 | $254,559 | $63,640 | $190,919 |
| 2014 | $2,581 | $249,572 | $62,393 | $187,179 |
Source: Public Records
Map
Nearby Homes
- 6157 Breckinridge Ct
- 4690 Avondale Ct
- 4602 Granville Ct
- 11610 Granville Place
- 13551 Barkley Place
- 5940 Breckinridge Ln
- 5881 Ashley Ct
- 5945 Olvera Ct
- 5963 Rosario St
- 13284 Cypress Ave
- 6594 Manzanita Ct
- 6614 Manzanita Ct
- 6212 Athena St
- 14000 San Antonio Ave
- 13185 14th St
- 13290 San Antonio Ave
- 5925 Riverside Dr Unit 12
- 5513 D St
- 12997 Falcon Place
- 14170 Durazno Ave
- 13560 Devonshire Ln
- 13576 Devonshire Ln
- 13571 Magnolia Ave
- 13579 Magnolia Ave
- 13552 Devonshire Ln
- 13563 Magnolia Ave
- 13587 Magnolia Ave
- 6131 Yorkshire Rd
- 13569 Devonshire Ln
- 13595 Magnolia Ave
- 13561 Devonshire Ln
- 13544 Devonshire Ln
- 6139 Yorkshire Rd
- 13553 Devonshire Ln
- 13547 Magnolia Ave
- 6147 Yorkshire Rd
- 13536 Devonshire Ln
- 13545 Devonshire Ln
- 13539 Magnolia Ave
- 6126 Carter Ct
Your Personal Tour Guide
Ask me questions while you tour the home.