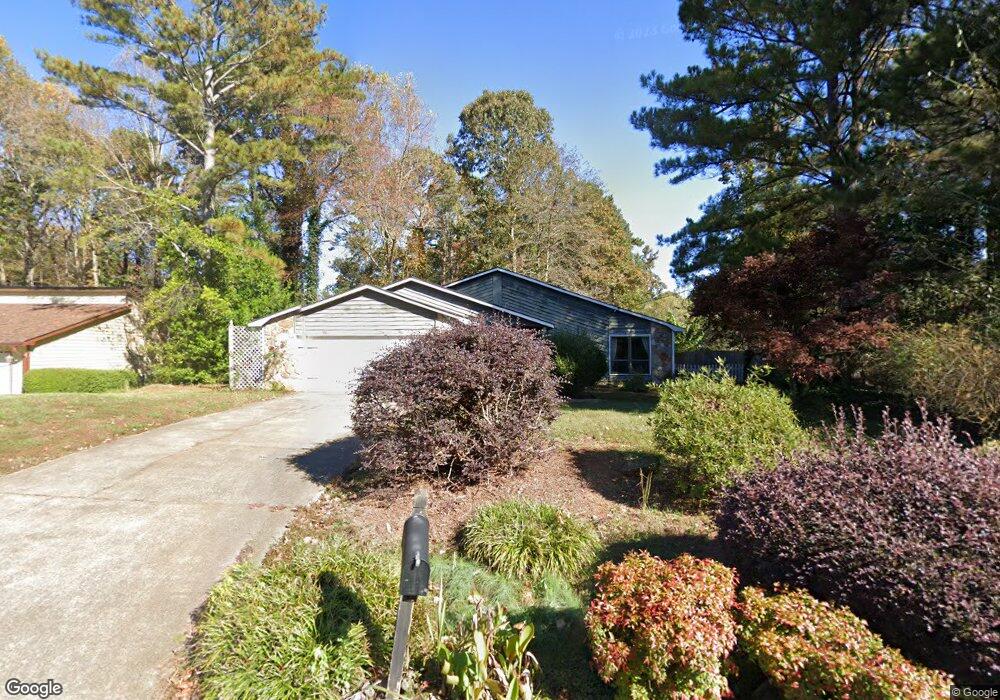
1357 Gray Rock Dr Unit 1 Marietta, GA 30066
Sandy Plains NeighborhoodEstimated Value: $346,000 - $419,000
3
Beds
2
Baths
1,802
Sq Ft
$215/Sq Ft
Est. Value
About This Home
This home is located at 1357 Gray Rock Dr Unit 1, Marietta, GA 30066 and is currently estimated at $387,033, approximately $214 per square foot. 1357 Gray Rock Dr Unit 1 is a home located in Cobb County with nearby schools including Keheley Elementary School, McCleskey Middle School, and Shiloh Hills Christian School.
Ownership History
Date
Name
Owned For
Owner Type
Purchase Details
Closed on
Jan 26, 2018
Sold by
Wallace James E
Bought by
Cushenberry Jessica M and Anderson Elizabeth J
Current Estimated Value
Home Financials for this Owner
Home Financials are based on the most recent Mortgage that was taken out on this home.
Original Mortgage
$173,992
Outstanding Balance
$148,518
Interest Rate
4.4%
Mortgage Type
FHA
Estimated Equity
$238,515
Purchase Details
Closed on
Mar 9, 2006
Sold by
Snyder David M and Snyder Barbara A
Bought by
Wallace James E
Purchase Details
Closed on
Sep 24, 1993
Sold by
Petraitis Mark S Judy A
Bought by
Snyder David M Barbara A
Home Financials for this Owner
Home Financials are based on the most recent Mortgage that was taken out on this home.
Original Mortgage
$94,061
Interest Rate
7.5%
Mortgage Type
VA
Create a Home Valuation Report for This Property
The Home Valuation Report is an in-depth analysis detailing your home's value as well as a comparison with similar homes in the area
Home Values in the Area
Average Home Value in this Area
Purchase History
| Date | Buyer | Sale Price | Title Company |
|---|---|---|---|
| Cushenberry Jessica M | $180,000 | -- | |
| Wallace James E | $155,000 | -- | |
| Snyder David M Barbara A | $92,900 | -- |
Source: Public Records
Mortgage History
| Date | Status | Borrower | Loan Amount |
|---|---|---|---|
| Open | Cushenberry Jessica M | $173,992 | |
| Previous Owner | Snyder David M Barbara A | $94,061 |
Source: Public Records
Tax History Compared to Growth
Tax History
| Year | Tax Paid | Tax Assessment Tax Assessment Total Assessment is a certain percentage of the fair market value that is determined by local assessors to be the total taxable value of land and additions on the property. | Land | Improvement |
|---|---|---|---|---|
| 2025 | $3,845 | $155,728 | $36,000 | $119,728 |
| 2024 | $3,598 | $144,188 | $34,800 | $109,388 |
| 2023 | $3,055 | $144,188 | $34,800 | $109,388 |
| 2022 | $2,442 | $90,140 | $25,200 | $64,940 |
| 2021 | $2,442 | $90,140 | $25,200 | $64,940 |
| 2020 | $1,912 | $72,000 | $20,680 | $51,320 |
| 2019 | $1,912 | $72,000 | $20,680 | $51,320 |
| 2018 | $2,663 | $87,736 | $25,200 | $62,536 |
| 2017 | $1,746 | $60,732 | $20,000 | $40,732 |
| 2016 | $1,746 | $60,732 | $20,000 | $40,732 |
| 2015 | $1,180 | $40,048 | $14,000 | $26,048 |
| 2014 | $1,190 | $40,048 | $0 | $0 |
Source: Public Records
Map
Nearby Homes
- 4816 Olde Mill Dr
- 2899 Treeside Terrace
- 4855 Rockford Ridge Dr
- 4680 Jamerson Forest Pkwy
- 4941 Willow Ln
- 1513 Jamerson Landing
- 1244 Hickory Wood Dr NE
- 1528 Forest Trace
- 4758 Jamerson Forest Cir
- 1634 Barrier Rd
- 421 Creek Valley Dr
- 4422 Inlet Rd
- 933 Old Noonday Sch House Rd
- 4924 Locklear Way
- 4413 Inlet Rd
- 5009 Kingsley Manor Ct
- 156 W Oaks Place
- 615 Bedford Ct
- 1351 Yorkshire Ln
- 1765 Blackwillow Dr
- 1359 Gray Rock Dr
- 1353 Gray Rock Dr Unit 1
- 4867 Olde Mill Dr
- 4859 Olde Mill Dr
- 1361 Gray Rock Dr
- 1356 Gray Rock Dr
- 4879 Olde Mill Dr
- 1358 Gray Rock Dr Unit 1
- 1354 Gray Rock Dr
- 1363 Gray Rock Dr
- 4891 Olde Mill Dr Unit 2
- 1352 Gray Rock Dr
- 1365 Gray Rock Dr
- 1351 Gray Rock Dr
- 1360 Gray Rock Dr
- 1350 Gray Rock Dr
- 1362 Gray Rock Dr
- 1349 Gray Rock Dr
- 4903 Olde Mill Dr Unit II
- 4861 Millview Ct