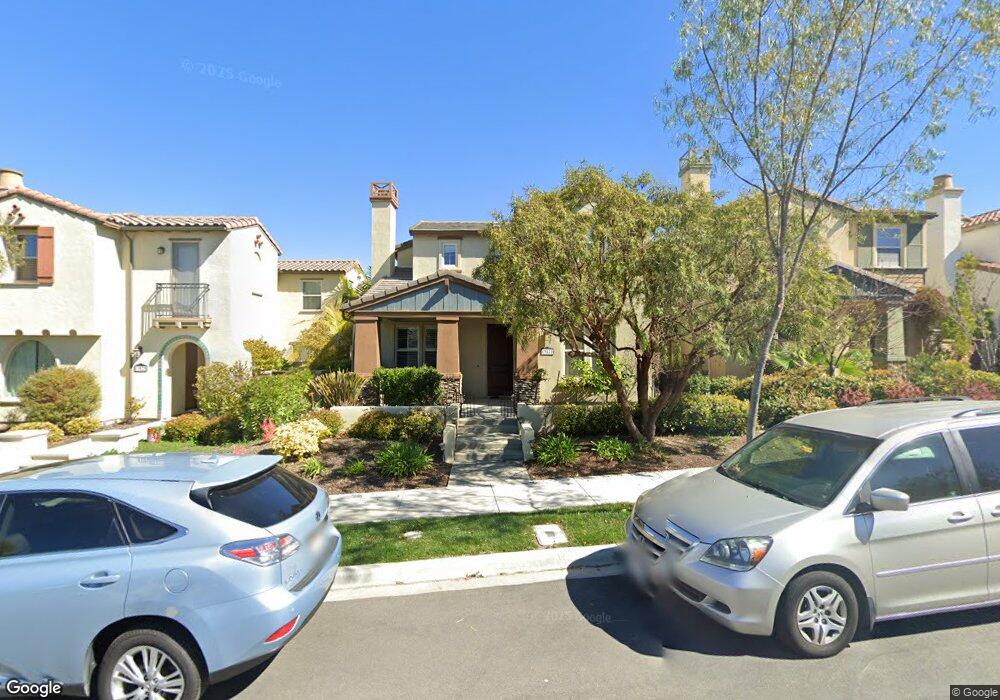
13571 Marguerite Creek Way San Diego, CA 92130
Carmel Valley NeighborhoodEstimated Value: $1,982,266 - $2,304,000
4
Beds
3
Baths
2,588
Sq Ft
$835/Sq Ft
Est. Value
About This Home
This home is located at 13571 Marguerite Creek Way, San Diego, CA 92130 and is currently estimated at $2,160,067, approximately $834 per square foot. 13571 Marguerite Creek Way is a home located in San Diego County with nearby schools including Solana Ranch Elementary School, Pacific Trails Middle, and Torrey Pines High School.
Ownership History
Date
Name
Owned For
Owner Type
Purchase Details
Closed on
Jan 1, 2017
Sold by
Liu Bin and Yu Chengzhi
Bought by
Liu Bin and Yu Chengzhi
Current Estimated Value
Purchase Details
Closed on
Nov 29, 2014
Sold by
Liu Bin and Yu Chengzhi
Bought by
Liu Bin and Yu Chengzhi
Home Financials for this Owner
Home Financials are based on the most recent Mortgage that was taken out on this home.
Original Mortgage
$167,000
Outstanding Balance
$86,848
Interest Rate
3.92%
Mortgage Type
Credit Line Revolving
Estimated Equity
$2,073,219
Purchase Details
Closed on
Jan 13, 2011
Sold by
Pardee Homes
Bought by
Liu Bin and Yu Chengzhi
Home Financials for this Owner
Home Financials are based on the most recent Mortgage that was taken out on this home.
Original Mortgage
$576,314
Interest Rate
4.71%
Mortgage Type
New Conventional
Create a Home Valuation Report for This Property
The Home Valuation Report is an in-depth analysis detailing your home's value as well as a comparison with similar homes in the area
Home Values in the Area
Average Home Value in this Area
Purchase History
| Date | Buyer | Sale Price | Title Company |
|---|---|---|---|
| Liu Bin | -- | None Available | |
| Liu Bin | -- | None Available | |
| Liu Bin | $720,500 | Chicago Title Company |
Source: Public Records
Mortgage History
| Date | Status | Borrower | Loan Amount |
|---|---|---|---|
| Open | Liu Bin | $167,000 | |
| Previous Owner | Liu Bin | $576,314 |
Source: Public Records
Tax History Compared to Growth
Tax History
| Year | Tax Paid | Tax Assessment Tax Assessment Total Assessment is a certain percentage of the fair market value that is determined by local assessors to be the total taxable value of land and additions on the property. | Land | Improvement |
|---|---|---|---|---|
| 2025 | $14,097 | $922,936 | $384,346 | $538,590 |
| 2024 | $14,097 | $904,840 | $376,810 | $528,030 |
| 2023 | $13,879 | $887,099 | $369,422 | $517,677 |
| 2022 | $13,716 | $869,706 | $362,179 | $507,527 |
| 2021 | $13,541 | $852,654 | $355,078 | $497,576 |
| 2020 | $13,457 | $843,912 | $351,438 | $492,474 |
| 2019 | $13,277 | $827,366 | $344,548 | $482,818 |
| 2018 | $13,105 | $811,144 | $337,793 | $473,351 |
| 2017 | $12,976 | $795,240 | $331,170 | $464,070 |
| 2016 | $12,703 | $779,648 | $324,677 | $454,971 |
| 2015 | $12,598 | $767,938 | $319,801 | $448,137 |
| 2014 | $12,460 | $752,896 | $313,537 | $439,359 |
Source: Public Records
Map
Nearby Homes
- 6265 Silverbush Creek St
- 6222 Artisan Way
- 13563 Chamise Vista Ln
- 6336 Sagebrush Bend Way
- 13441 Banyan Way
- 13348 Camelia Way
- 13016 Lumen Way
- 12932 Peppergrass Creek Gate Unit 58
- 13568 Bolero Way
- 13032 Alora Point Unit 170
- 13033 Lamia Point Unit 217
- 13233 Petunia Way
- 6744 Monterra Trail
- 14619 Calle Carla
- 13165 Caminito Mendiola
- 5621 Shasta Daisy Trail
- 7001 Via Agave
- 5347 Morning Sage Way
- 5312 Sweetwater Trail
- 7066 Via Agave
- 13567 Marguerite Creek Way
- 13573 Marguerite Creek Way
- 13565 Marguerite Creek Way
- 13577 Marguerite Creek Way
- 13561 Marguerite Creek Way
- 13579 Marguerite Creek Way
- 13584 Lopelia Meadows Place
- 13576 Lopelia Meadows Place
- 13588 Lopelia Meadows Place
- 13572 Lopelia Meadows Place
- 13568 Marguerite Creek Way
- 13583 Marguerite Creek Way
- 13572 Marguerite Creek Way
- 13568 Lopelia Meadows Place
- 13592 Lopelia Meadows Place
- 13562 Marguerite Creek Way
- 13576 Marguerite Creek Way
- 13555 Marguerite Creek Way
- 13560 Marguerite Creek Way
- 13564 Lopelia Meadows Place