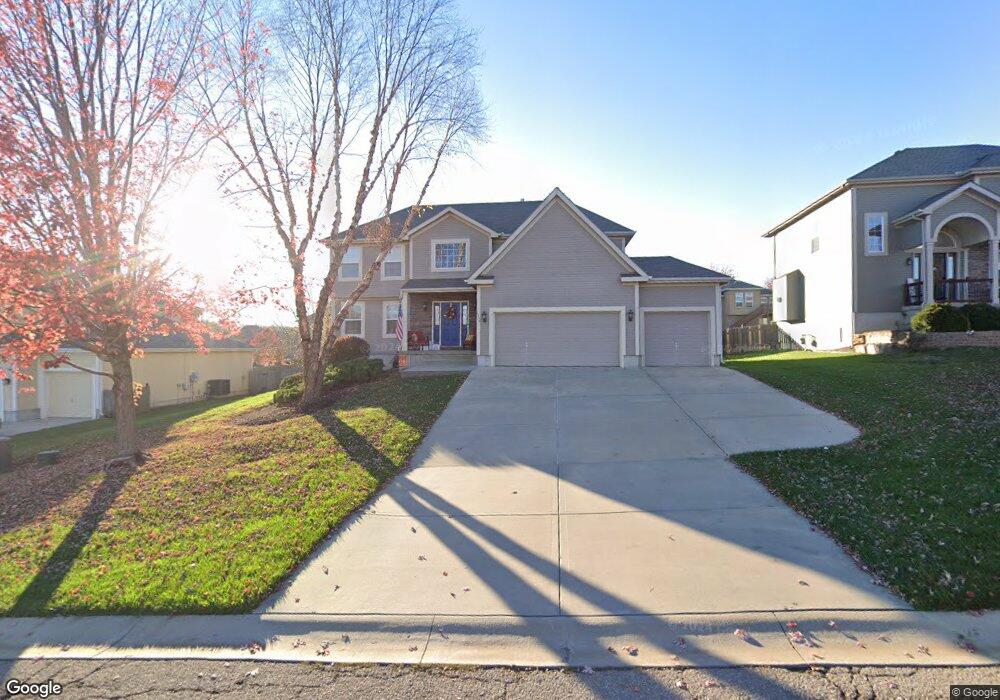
1358 Granite St Lansing, KS 66043
Estimated Value: $442,851 - $545,000
5
Beds
4
Baths
2,720
Sq Ft
$180/Sq Ft
Est. Value
About This Home
This home is located at 1358 Granite St, Lansing, KS 66043 and is currently estimated at $488,463, approximately $179 per square foot. 1358 Granite St is a home located in Leavenworth County with nearby schools including Lansing Elementary School, Lansing Middle 6-8, and Lansing High 9-12.
Ownership History
Date
Name
Owned For
Owner Type
Purchase Details
Closed on
Jan 27, 2011
Sold by
Jmk Partners Llc
Bought by
M & J Properties Llc
Current Estimated Value
Home Financials for this Owner
Home Financials are based on the most recent Mortgage that was taken out on this home.
Original Mortgage
$255,000
Outstanding Balance
$174,987
Interest Rate
4.84%
Mortgage Type
New Conventional
Estimated Equity
$313,476
Create a Home Valuation Report for This Property
The Home Valuation Report is an in-depth analysis detailing your home's value as well as a comparison with similar homes in the area
Home Values in the Area
Average Home Value in this Area
Purchase History
| Date | Buyer | Sale Price | Title Company |
|---|---|---|---|
| M & J Properties Llc | $318,750 | Mccaffree-Short Title Co Inc |
Source: Public Records
Mortgage History
| Date | Status | Borrower | Loan Amount |
|---|---|---|---|
| Open | M & J Properties Llc | $255,000 |
Source: Public Records
Tax History
| Year | Tax Paid | Tax Assessment Tax Assessment Total Assessment is a certain percentage of the fair market value that is determined by local assessors to be the total taxable value of land and additions on the property. | Land | Improvement |
|---|---|---|---|---|
| 2025 | $6,708 | $51,419 | $5,794 | $45,625 |
| 2024 | $6,205 | $49,441 | $5,794 | $43,647 |
| 2023 | $6,205 | $47,539 | $5,794 | $41,745 |
| 2022 | $5,966 | $43,217 | $4,856 | $38,361 |
| 2021 | $5,761 | $39,905 | $4,856 | $35,049 |
| 2020 | $5,429 | $37,018 | $4,856 | $32,162 |
| 2019 | $5,334 | $36,328 | $4,856 | $31,472 |
| 2018 | $5,332 | $36,328 | $4,856 | $31,472 |
| 2017 | $5,282 | $35,914 | $4,856 | $31,058 |
| 2016 | $5,403 | $36,708 | $4,856 | $31,852 |
| 2015 | -- | $36,708 | $4,856 | $31,852 |
| 2014 | -- | $35,157 | $4,856 | $30,301 |
Source: Public Records
Map
Nearby Homes
- 1313 Stone Ln
- 898 Clearview Dr
- 1322 Rock Creek Ct
- 1221 S Desoto Rd
- 875 Clearview Dr
- 712 Rock Creek Dr
- 111 Southfork Rd
- 189 Canyon View Dr
- 811 4-H Rd
- 922 Southfork St
- 24431 139th St
- 13965 Mc Intyre Rd
- 26731 147th St
- 13788 McIntyre1 Rd
- 13788 Mcintyre Rd
- 13788 McIntyre2 Rd
- 25060 159th St
- 503 S 1st St
- 202 S Main St
- 124 S Main St
Your Personal Tour Guide
Ask me questions while you tour the home.