Estimated Value: $233,000 - $490,982
4
Beds
4
Baths
3,878
Sq Ft
$96/Sq Ft
Est. Value
About This Home
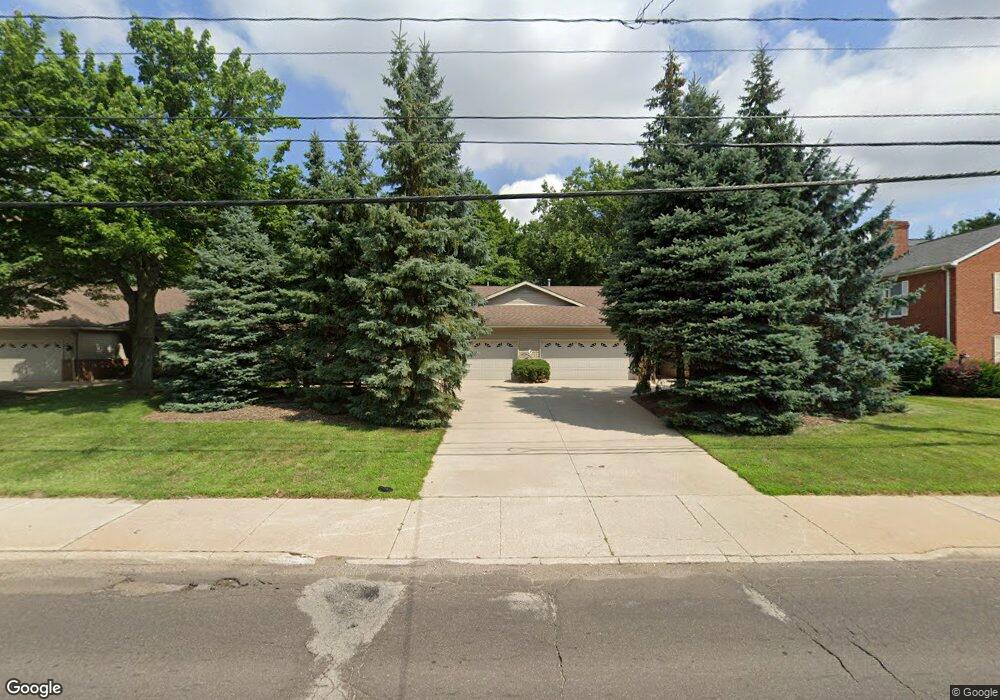
This home is located at 1359 E Main St, Kent, OH 44240 and is currently estimated at $373,994, approximately $96 per square foot. 1359 E Main St is a home located in Portage County with nearby schools including Walls Elementary School, Stanton Middle School, and Theodore Roosevelt High School.
Ownership History
Date
Name
Owned For
Owner Type
Purchase Details
Closed on
Aug 6, 2018
Sold by
Vance Dale R and Vance Dale
Bought by
Escape Plan 1 Llc
Current Estimated Value
Purchase Details
Closed on
Jan 5, 2018
Sold by
Rlp Builders Llc
Bought by
Vance Dale and Vance Phuong
Home Financials for this Owner
Home Financials are based on the most recent Mortgage that was taken out on this home.
Interest Rate
3.95%
Purchase Details
Closed on
Dec 23, 2011
Sold by
Rp Builders Llc
Bought by
Rlp Builders Llc
Purchase Details
Closed on
Feb 13, 2002
Sold by
Petrone Robert L
Bought by
Rp Builders
Purchase Details
Closed on
Aug 31, 2001
Sold by
J E L Investment Co Lp and Nehrer John A
Bought by
Petrone Robert
Purchase Details
Closed on
Dec 22, 1999
Sold by
Lohman Joseph E
Bought by
J E L Investment Co Lp
Purchase Details
Closed on
Mar 30, 1994
Bought by
Nehrer John A Trustee
Create a Home Valuation Report for This Property
The Home Valuation Report is an in-depth analysis detailing your home's value as well as a comparison with similar homes in the area
Home Values in the Area
Average Home Value in this Area
Purchase History
| Date | Buyer | Sale Price | Title Company |
|---|---|---|---|
| Escape Plan 1 Llc | -- | None Available | |
| Vance Dale R | -- | None Available | |
| Vance Dale | $572,000 | -- | |
| Rlp Builders Llc | $400,000 | Attorney | |
| Rp Builders | -- | Lawyers Title | |
| Petrone Robert | $99,000 | Lawyers Title | |
| J E L Investment Co Lp | -- | -- | |
| Nehrer John A Trustee | -- | -- |
Source: Public Records
Mortgage History
| Date | Status | Borrower | Loan Amount |
|---|---|---|---|
| Previous Owner | Vance Dale | -- |
Source: Public Records
Tax History
| Year | Tax Paid | Tax Assessment Tax Assessment Total Assessment is a certain percentage of the fair market value that is determined by local assessors to be the total taxable value of land and additions on the property. | Land | Improvement |
|---|---|---|---|---|
| 2024 | $7,207 | $156,700 | $30,210 | $126,490 |
| 2023 | $6,676 | $117,750 | $24,890 | $92,860 |
| 2022 | $6,671 | $117,750 | $24,890 | $92,860 |
| 2021 | $6,684 | $117,750 | $24,890 | $92,860 |
| 2020 | $6,203 | $97,450 | $24,890 | $72,560 |
| 2019 | $6,204 | $97,450 | $24,890 | $72,560 |
| 2018 | $4,958 | $72,030 | $18,970 | $53,060 |
| 2017 | $4,958 | $72,030 | $18,970 | $53,060 |
| 2016 | $4,946 | $72,030 | $18,970 | $53,060 |
| 2015 | $4,948 | $72,030 | $18,970 | $53,060 |
| 2014 | $5,031 | $72,030 | $18,970 | $53,060 |
| 2013 | $4,995 | $72,030 | $18,970 | $53,060 |
Source: Public Records
Map
Nearby Homes
- 1103 Oakwood Dr
- 1737 Holly Dr
- 6235 1st Ave
- 1585 Kent St
- 6318 1st Ave
- 835 Mae St
- 1426 Loop Rd Unit 1426
- 1005 Vine St
- 326 Pleasant Ave
- 4363 Ohio 43
- 0 S Water St
- 6297 Westshore Dr
- 529 Rockwell St
- 1951 Walton Rd
- 2135 Rankin Dr
- 209 Dodge St
- 1204 Franklin Ave
- 1024E Cedar Ridge Dr
- 6181 Washington St
- 410 Beryl Dr
- 1325 E Main St
- 1401 E Main St
- 1405 E Main St
- 1397 E Main St
- 1403 E Main St Unit E
- 1395 E Main St Unit F
- 1399 E Main St Unit C
- 122 Overlook Dr
- 1237 Fairview Dr
- 130 Overlook Dr
- 35 Overlook Dr
- 1235 Fairview Dr
- 123 Overlook Dr
- 1233 Fairview Dr
- 204 Overlook Dr
- 1234 Fairview Dr
- 210 Overlook Dr
- 1415 E Main St Unit 1
- 1231 Fairview Dr
- 1230 Fairview Dr
Your Personal Tour Guide
Ask me questions while you tour the home.