Estimated payment $2,016/month
Highlights
- 2 Car Attached Garage
- Laundry Room
- Parking Storage or Cabinetry
- Patio
- Bathroom on Main Level
- Forced Air Heating and Cooling System
About This Home
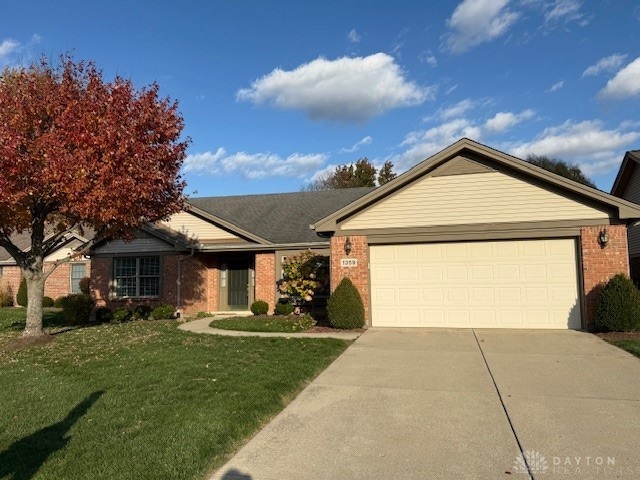
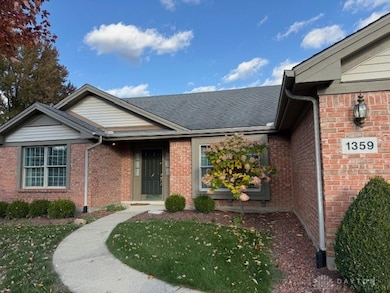
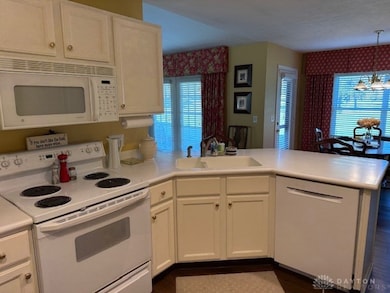
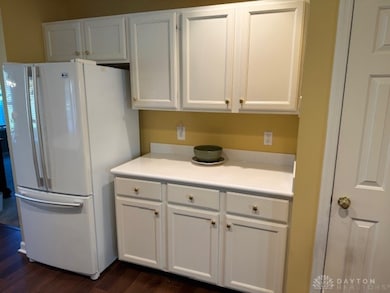
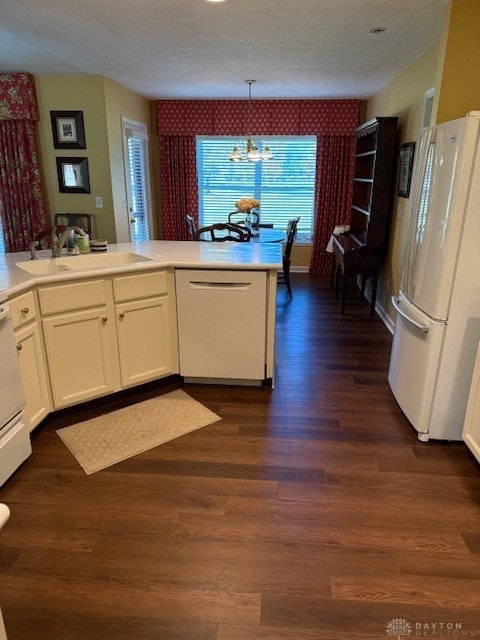
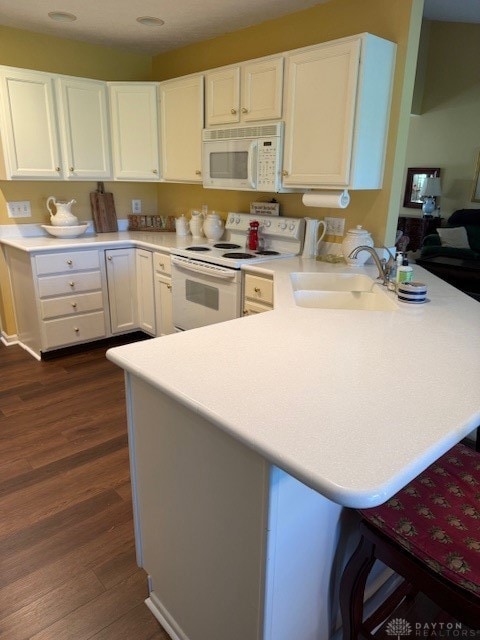
Welcome to this charming brick ranch home in the Eagles Way community! This 3-bedroom, 2-bathroom property boasts over 1,800 square feet of living space. The home features a spacious eat-in kitchen with patio access, offering stunning views of the WGC Golf Course. Enjoy the large living room, dining room, separate laundry room, and convenient 2-car garage. The primary bedroom is generously sized, complete with a large walk-in closet, a bathroom with double sinks, and a walk-in shower. The additional two bedrooms and full bathroom are located just off the living room on the opposite side of the home. All appliances, including the washer and dryer, are included. Don't miss out on making this beautiful home yours!
Listing Agent
McIlvaine Realty Brokerage Phone: (937) 372-3577 License #0000148925 Listed on: 11/05/2025
Home Details
Home Type
- Single Family
Est. Annual Taxes
- $3,431
Year Built
- 1996
Lot Details
- 7,536 Sq Ft Lot
- Lot Dimensions are 65x121
HOA Fees
- $100 Monthly HOA Fees
Parking
- 2 Car Attached Garage
- Parking Storage or Cabinetry
- Garage Door Opener
Home Design
- Brick Exterior Construction
- Slab Foundation
- Vinyl Siding
Interior Spaces
- 1,805 Sq Ft Home
- 1-Story Property
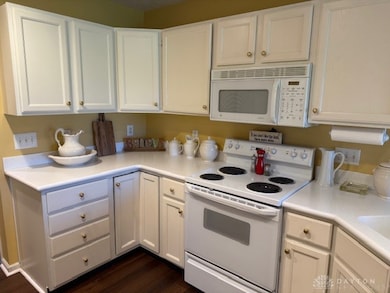
Kitchen
- Range
- Microwave
- Dishwasher
- Disposal
Bedrooms and Bathrooms
- 3 Bedrooms
- Bathroom on Main Level
- 2 Full Bathrooms
Laundry
- Laundry Room
- Dryer
- Washer
Outdoor Features
- Patio
Utilities
- Forced Air Heating and Cooling System
- Heating System Uses Natural Gas
- Water Softener
Community Details
- Association fees include ground maintenance, snow removal
- Eagles Way Subdivision
Listing and Financial Details
- Assessor Parcel Number M40000200200001400
Map
Home Values in the Area
Average Home Value in this Area
Tax History
| Year | Tax Paid | Tax Assessment Tax Assessment Total Assessment is a certain percentage of the fair market value that is determined by local assessors to be the total taxable value of land and additions on the property. | Land | Improvement |
|---|---|---|---|---|
| 2024 | $3,431 | $92,100 | $22,320 | $69,780 |
| 2023 | $3,431 | $92,100 | $22,320 | $69,780 |
| 2022 | $2,950 | $69,070 | $15,940 | $53,130 |
| 2021 | $2,990 | $69,070 | $15,940 | $53,130 |
| 2020 | $2,174 | $69,070 | $15,940 | $53,130 |
| 2019 | $2,174 | $51,890 | $11,130 | $40,760 |
| 2018 | $2,183 | $51,890 | $11,130 | $40,760 |
| 2017 | $2,222 | $51,890 | $11,130 | $40,760 |
| 2016 | $2,223 | $51,890 | $11,130 | $40,760 |
| 2015 | $1,115 | $51,890 | $11,130 | $40,760 |
| 2014 | $1,066 | $51,890 | $11,130 | $40,760 |
Property History
| Date | Event | Price | List to Sale | Price per Sq Ft |
|---|---|---|---|---|
| 11/05/2025 11/05/25 | For Sale | $309,900 | -- | $172 / Sq Ft |
Purchase History
| Date | Type | Sale Price | Title Company |
|---|---|---|---|
| Warranty Deed | $177,500 | Attorney | |
| Deed | $139,900 | -- | |
| Deed | $23,000 | -- |
Mortgage History
| Date | Status | Loan Amount | Loan Type |
|---|---|---|---|
| Open | $150,800 | Unknown | |
| Previous Owner | $105,500 | New Conventional |
Source: Dayton REALTORS®
MLS Number: 947237
APN: M40-0002-0020-0-0014-00
Disclaimer: Certain information contained herein is derived from information provided by parties other than Homes.com. All information provided is deemed reliable, but is not guaranteed to be accurate and should be independently verified.
![]() The information is being provided by Dayton Area Board of Realtors MLS. Information deemed reliable but not guaranteed. Information is provided for the consumer's personal, non-commercial use, and may not be used for any purpose other than the identification of potential properties for purchase. Copyright 2025 Dayton Area Board of Realtors MLS. All Rights Reserved.
The information is being provided by Dayton Area Board of Realtors MLS. Information deemed reliable but not guaranteed. Information is provided for the consumer's personal, non-commercial use, and may not be used for any purpose other than the identification of potential properties for purchase. Copyright 2025 Dayton Area Board of Realtors MLS. All Rights Reserved.
- 1311 Eagles Way
- 965 Oak Dale Dr
- 983 Echo Ct
- 656 Eden Roc Dr
- 1764 Highlander Dr
- 460 Kinsey Rd
- 610 Saxony Dr
- 513 Redbud Ln
- 508 Marshall Dr
- 1038 Frederick Dr
- 1171 N Detroit St
- 568 Louise Dr
- 902 N Detroit St
- 878 N Detroit St
- 479 N Stadium Dr
- 348 S Stadium Dr
- 15 Sexton Dr
- 2018 Tahoe Dr
- 659 N King St
- 516 N King St
- 643 Smith Ave
- 1600 Deer Creek Dr
- 475 Stelton Rd Unit 479
- 475 Stelton Rd Unit 475
- 769 Hilltop Rd
- 1479 Colorado Dr
- 1255 Arkansas Dr
- 1337 Vimla Way
- 1302 Shannon Ln
- 1400 Parkman Place Unit 1406
- 1075 Meadow Dr
- 2436 Sherbourne Way
- 2250 Warbler Ln
- 337 Honey Jane Dr
- 2435 Forest Oaks Dr
- 2486 Roseanne Ct
- 2201 Roseanne Ct
- 1302 Hemmingway Dr
- 1130 Cymar Dr E
- 2208-2228 Chapel Dr
