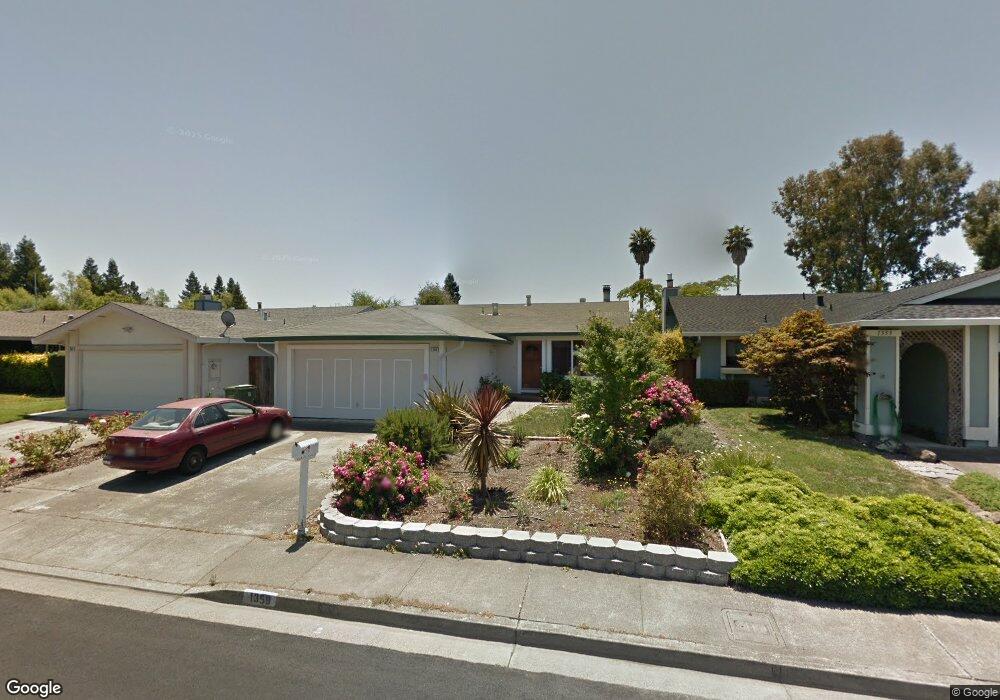
1359 Garmont Ct Rohnert Park, CA 94928
Estimated Value: $696,000 - $768,000
3
Beds
3
Baths
1,746
Sq Ft
$418/Sq Ft
Est. Value
About This Home
This home is located at 1359 Garmont Ct, Rohnert Park, CA 94928 and is currently estimated at $730,408, approximately $418 per square foot. 1359 Garmont Ct is a home located in Sonoma County with nearby schools including Rancho Cotate High School, Cross & Crown Lutheran School, and Bridghaven.
Ownership History
Date
Name
Owned For
Owner Type
Purchase Details
Closed on
Jun 2, 2021
Sold by
Eiermann Bess Jane
Bought by
Eiermann Bess Jane and The Bess J Eiermann 2008 Revoc
Current Estimated Value
Home Financials for this Owner
Home Financials are based on the most recent Mortgage that was taken out on this home.
Original Mortgage
$200,000
Outstanding Balance
$181,075
Interest Rate
2.9%
Mortgage Type
New Conventional
Estimated Equity
$549,333
Purchase Details
Closed on
Mar 7, 2008
Sold by
Eiermann Bess Jane
Bought by
Eiermann Bess Jane and Bess J Eiermann 2008 Revocable
Purchase Details
Closed on
Sep 9, 1993
Sold by
Mccleery Michael A and Mccleery Susan
Bought by
Eiermann Bess Jane
Home Financials for this Owner
Home Financials are based on the most recent Mortgage that was taken out on this home.
Original Mortgage
$148,450
Interest Rate
7.25%
Create a Home Valuation Report for This Property
The Home Valuation Report is an in-depth analysis detailing your home's value as well as a comparison with similar homes in the area
Home Values in the Area
Average Home Value in this Area
Purchase History
| Date | Buyer | Sale Price | Title Company |
|---|---|---|---|
| Eiermann Bess Jane | -- | Cal Land Title Company | |
| Eiermann Bess Jane | -- | Cal Land Title Company | |
| Eiermann Bess Jane | -- | None Available | |
| Eiermann Bess Jane | $165,000 | Old Republic Title Company |
Source: Public Records
Mortgage History
| Date | Status | Borrower | Loan Amount |
|---|---|---|---|
| Open | Eiermann Bess Jane | $200,000 | |
| Closed | Eiermann Bess Jane | $148,450 |
Source: Public Records
Tax History Compared to Growth
Tax History
| Year | Tax Paid | Tax Assessment Tax Assessment Total Assessment is a certain percentage of the fair market value that is determined by local assessors to be the total taxable value of land and additions on the property. | Land | Improvement |
|---|---|---|---|---|
| 2025 | $3,197 | $280,846 | $136,165 | $144,681 |
| 2024 | $3,197 | $275,341 | $133,496 | $141,845 |
| 2023 | $3,197 | $269,943 | $130,879 | $139,064 |
| 2022 | $3,131 | $264,651 | $128,313 | $136,338 |
| 2021 | $3,104 | $259,463 | $125,798 | $133,665 |
| 2020 | $3,147 | $256,804 | $124,509 | $132,295 |
| 2019 | $3,105 | $251,769 | $122,068 | $129,701 |
| 2018 | $3,045 | $246,833 | $119,675 | $127,158 |
| 2017 | $2,992 | $241,994 | $117,329 | $124,665 |
| 2016 | $2,864 | $237,250 | $115,029 | $122,221 |
| 2015 | $2,794 | $233,688 | $113,302 | $120,386 |
| 2014 | $2,773 | $229,111 | $111,083 | $118,028 |
Source: Public Records
Map
Nearby Homes
- 1374 Gaspar Ct
- 1511 Gladstone Way
- 1451 Gold Way
- 5573 Petaluma Hill Rd
- 1044 Eleanor Ave
- 5655 Petaluma Hill Rd
- 1026 Eleanor Ave Unit A
- 978 Eleanor Ave
- 985 Hacienda Cir
- 1106 Elvera St
- 5032 Country Club Dr
- 1140 Emily Ave
- 954 Eleanor Ave
- 5200 Petaluma Hill Rd
- 690 Holly Ave
- 534 Mountain View Ave
- 15 Francis Cir
- 524 Mountain View Ave
- 159 Francis Cir
- 27 Fredrick Dr
- 1363 Garmont Ct
- 1355 Garmont Ct
- 1367 Garmont Ct
- 1351 Garmont Ct
- 1358 Gaspar Ct
- 1362 Gaspar Ct
- 1354 Gaspar Ct
- 1371 Garmont Ct
- 1366 Gaspar Ct
- 1347 Garmont Ct
- 1350 Gaspar Ct
- 1360 Garmont Ct
- 1356 Garmont Ct
- 1352 Garmont Ct
- 1346 Gaspar Ct
- 1370 Gaspar Ct
- 1341 Garmont Ct
- 1375 Garmont Ct
- 1348 Garmont Ct
- 1368 Garmont Ct