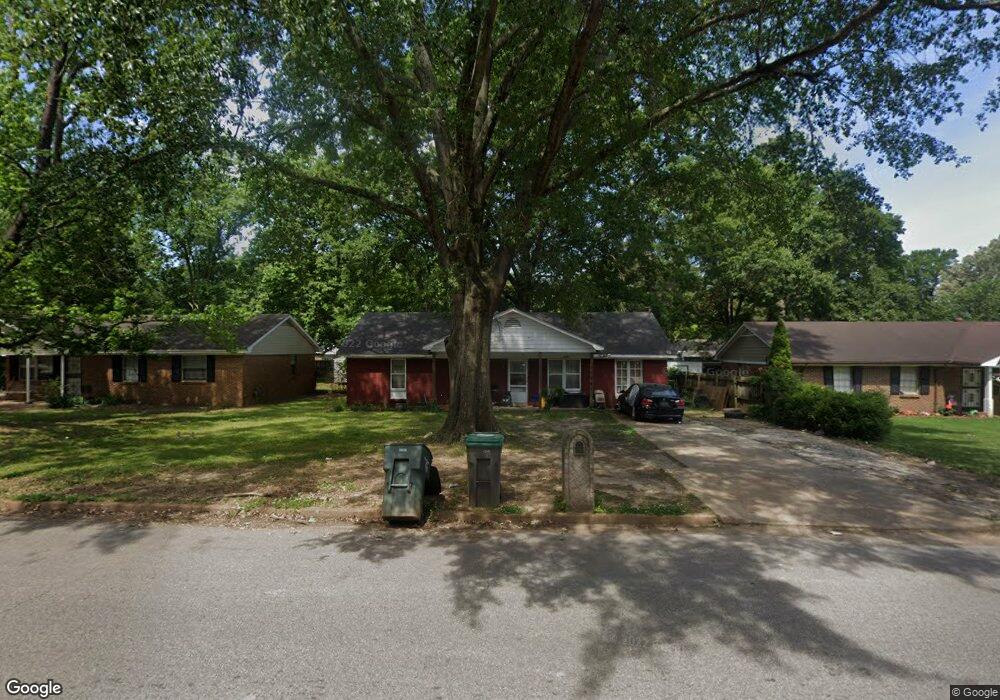
1359 Mullins Station Rd Memphis, TN 38134
Cordova NeighborhoodEstimated Value: $147,000 - $193,000
4
Beds
1
Bath
1,370
Sq Ft
$126/Sq Ft
Est. Value
About This Home
This home is located at 1359 Mullins Station Rd, Memphis, TN 38134 and is currently estimated at $172,750, approximately $126 per square foot. 1359 Mullins Station Rd is a home located in Shelby County with nearby schools including White Station Elementary School, White Station Middle, and White Station High.
Ownership History
Date
Name
Owned For
Owner Type
Purchase Details
Closed on
Nov 21, 2019
Sold by
Flores Monica Moreno
Bought by
Flores Monica Moreno and Silva Jose Reyes
Current Estimated Value
Home Financials for this Owner
Home Financials are based on the most recent Mortgage that was taken out on this home.
Original Mortgage
$52,894
Outstanding Balance
$46,533
Interest Rate
3.6%
Mortgage Type
Stand Alone Second
Estimated Equity
$126,217
Purchase Details
Closed on
Feb 24, 2013
Sold by
Reyes Jose
Bought by
Flores Monica Moreno
Purchase Details
Closed on
May 3, 1996
Sold by
Ferrell Herbert L
Bought by
Reyes Jose and Reyes Monica M
Home Financials for this Owner
Home Financials are based on the most recent Mortgage that was taken out on this home.
Original Mortgage
$63,500
Interest Rate
7.99%
Mortgage Type
Seller Take Back
Create a Home Valuation Report for This Property
The Home Valuation Report is an in-depth analysis detailing your home's value as well as a comparison with similar homes in the area
Home Values in the Area
Average Home Value in this Area
Purchase History
| Date | Buyer | Sale Price | Title Company |
|---|---|---|---|
| Flores Monica Moreno | -- | None Available | |
| Flores Monica Moreno | -- | None Available | |
| Reyes Jose | $67,500 | -- |
Source: Public Records
Mortgage History
| Date | Status | Borrower | Loan Amount |
|---|---|---|---|
| Open | Flores Monica Moreno | $52,894 | |
| Previous Owner | Reyes Jose | $63,500 |
Source: Public Records
Tax History Compared to Growth
Tax History
| Year | Tax Paid | Tax Assessment Tax Assessment Total Assessment is a certain percentage of the fair market value that is determined by local assessors to be the total taxable value of land and additions on the property. | Land | Improvement |
|---|---|---|---|---|
| 2025 | $302 | $35,775 | $5,750 | $30,025 |
| 2024 | $453 | $26,700 | $4,250 | $22,450 |
| 2023 | $1,626 | $26,700 | $4,250 | $22,450 |
| 2022 | $1,626 | $26,700 | $4,250 | $22,450 |
| 2021 | $1,933 | $26,700 | $4,250 | $22,450 |
| 2020 | $1,270 | $17,525 | $4,250 | $13,275 |
| 2019 | $560 | $17,525 | $4,250 | $13,275 |
| 2018 | $560 | $17,525 | $4,250 | $13,275 |
| 2017 | $573 | $17,525 | $4,250 | $13,275 |
| 2016 | $681 | $15,575 | $0 | $0 |
| 2014 | $681 | $15,575 | $0 | $0 |
Source: Public Records
Map
Nearby Homes
- 1339 Mullins Station Rd
- 1289 Heathcliff Dr
- 1472 Kinilwood St
- 6378 Limewood Ave
- 0 Mullins Station Rd
- 6690 Whitten Pine Dr
- 1461 Phillips Rd
- 6774 Whitten Pine Dr
- 6840 Kamali Ave
- 6830 Garmin Ln
- 6838 Lagrange Cir N
- 6840 Lagrange Pines Rd
- 6880 Wrigley Dr
- 6916 Lagrange Pines Rd
- 6925 Raleigh Lagrange Rd
- 7035 S Estacada Way
- 7004 Presmond Rd
- 7020 Wynne Ridge Rd N
- 6990 Parkbrook Ln
- 7115 Lindsey Leaf Cove
- 1353 Mullins Station Rd
- 1365 Mullins Station Rd
- 1358 Jane Eyre St
- 1345 Mullins Station Rd
- 1373 Mullins Station Rd
- 1366 Jane Eyre St
- 1352 Jane Eyre St
- 6382 Saginaw Rd
- 1346 Jane Eyre St
- 1379 Mullins Station Rd
- 1360 Mullins Station Rd
- 6352 Bronte Ave
- 6390 Saginaw Rd
- 1364 Mullins Station Rd
- 1338 Jane Eyre St
- 6383 Saginaw Rd
- 1333 Mullins Station Rd
- 6346 Bronte Ave
- 6365 Macon Rd
- 6337 Bronte Ave