Estimated Value: $619,000 - $746,000
4
Beds
2
Baths
1,586
Sq Ft
$439/Sq Ft
Est. Value
About This Home
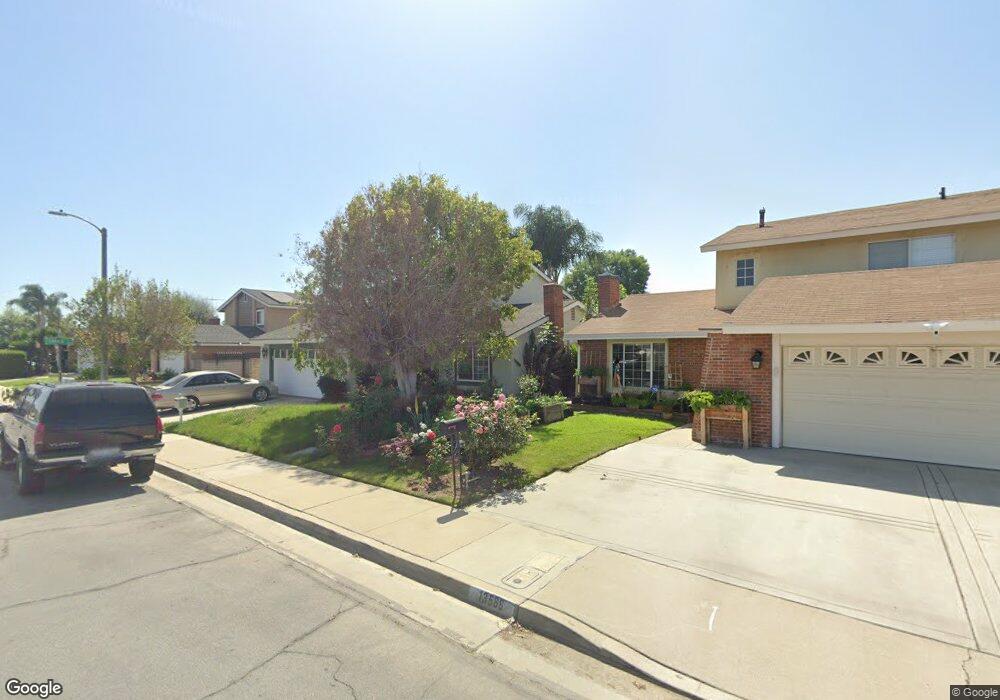
This home is located at 13590 Frady Ave, Chino, CA 91710 and is currently estimated at $695,847, approximately $438 per square foot. 13590 Frady Ave is a home located in San Bernardino County with nearby schools including Dickson Elementary, Ramona Junior High School, and Don Antonio Lugo High School.
Ownership History
Date
Name
Owned For
Owner Type
Purchase Details
Closed on
Jan 30, 2006
Sold by
Dudley Hincks Gale L and Hincks David
Bought by
Raleigh Dudley Hincks Gale L and Raleigh Thomas
Current Estimated Value
Home Financials for this Owner
Home Financials are based on the most recent Mortgage that was taken out on this home.
Original Mortgage
$215,000
Outstanding Balance
$121,036
Interest Rate
6.2%
Mortgage Type
New Conventional
Estimated Equity
$574,811
Purchase Details
Closed on
Nov 11, 2002
Sold by
Thomas Raleigh and Thomas Janet
Bought by
Raleigh Dudley Gale L and Raleigh Thomas
Home Financials for this Owner
Home Financials are based on the most recent Mortgage that was taken out on this home.
Original Mortgage
$174,000
Interest Rate
7.05%
Purchase Details
Closed on
Sep 23, 2002
Sold by
Dudley Gale L
Bought by
Thomas Raleigh and Thomas Janet
Home Financials for this Owner
Home Financials are based on the most recent Mortgage that was taken out on this home.
Original Mortgage
$174,000
Interest Rate
7.05%
Create a Home Valuation Report for This Property
The Home Valuation Report is an in-depth analysis detailing your home's value as well as a comparison with similar homes in the area
Home Values in the Area
Average Home Value in this Area
Purchase History
| Date | Buyer | Sale Price | Title Company |
|---|---|---|---|
| Raleigh Dudley Hincks Gale L | -- | None Available | |
| Raleigh Dudley Gale L | -- | -- | |
| Thomas Raleigh | -- | United Title |
Source: Public Records
Mortgage History
| Date | Status | Borrower | Loan Amount |
|---|---|---|---|
| Open | Raleigh Dudley Hincks Gale L | $215,000 | |
| Closed | Thomas Raleigh | $174,000 |
Source: Public Records
Tax History Compared to Growth
Tax History
| Year | Tax Paid | Tax Assessment Tax Assessment Total Assessment is a certain percentage of the fair market value that is determined by local assessors to be the total taxable value of land and additions on the property. | Land | Improvement |
|---|---|---|---|---|
| 2025 | $3,320 | $311,915 | $89,685 | $222,230 |
| 2024 | $3,320 | $305,799 | $87,926 | $217,873 |
| 2023 | $3,227 | $299,803 | $86,202 | $213,601 |
| 2022 | $3,207 | $293,925 | $84,512 | $209,413 |
| 2021 | $3,143 | $288,162 | $82,855 | $205,307 |
| 2020 | $3,101 | $285,207 | $82,005 | $203,202 |
| 2019 | $3,046 | $279,615 | $80,397 | $199,218 |
| 2018 | $2,977 | $274,133 | $78,821 | $195,312 |
| 2017 | $2,923 | $268,757 | $77,275 | $191,482 |
| 2016 | $2,730 | $263,487 | $75,760 | $187,727 |
| 2015 | $2,748 | $259,529 | $74,622 | $184,907 |
| 2014 | $2,694 | $254,445 | $73,160 | $181,285 |
Source: Public Records
Map
Nearby Homes
- 3947 Jose Ct
- 13798 Roswell Ave
- 13640 Norton Ave
- 3516 Larkwood Dr
- 13639 Meadow Crest Dr
- 13232 Yorkers Place Unit C
- 13401 Wisteria Place
- 3185 Skyview Ridge
- 3557 Riverside Dr
- 3107 Greenacre Rd
- 4449 Carmen St
- 4440 Carmen St
- 4621 Chino Ave
- 12958 Boston Ave
- 13139 Derby Ave
- 4539 Carmen St
- 4524 Carmen St
- 3778 Pilgrims Way
- 0 Pilgrims Way
- 3786 Daisy Dr
- 13588 Frady Ave
- 13618 Frady Ave
- 13584 Frady Ave
- 13626 Frady Ave
- 13589 Frady Ave
- 13580 Frady Ave
- 13585 Frady Ave
- 13619 Frady Ave
- 13634 Frady Ave
- 3801 Carlos Ct
- 3814 Carlos Ct
- 3814 Lupe Ct
- 13627 Frady Ave
- 3839 Lupe Ct
- 13572 Frady Ave
- 13581 Frady Ave
- 3797 Carlos Ct
- 13642 Frady Ave
- 3802 Lupe Ct
- 13579 Frady Ave