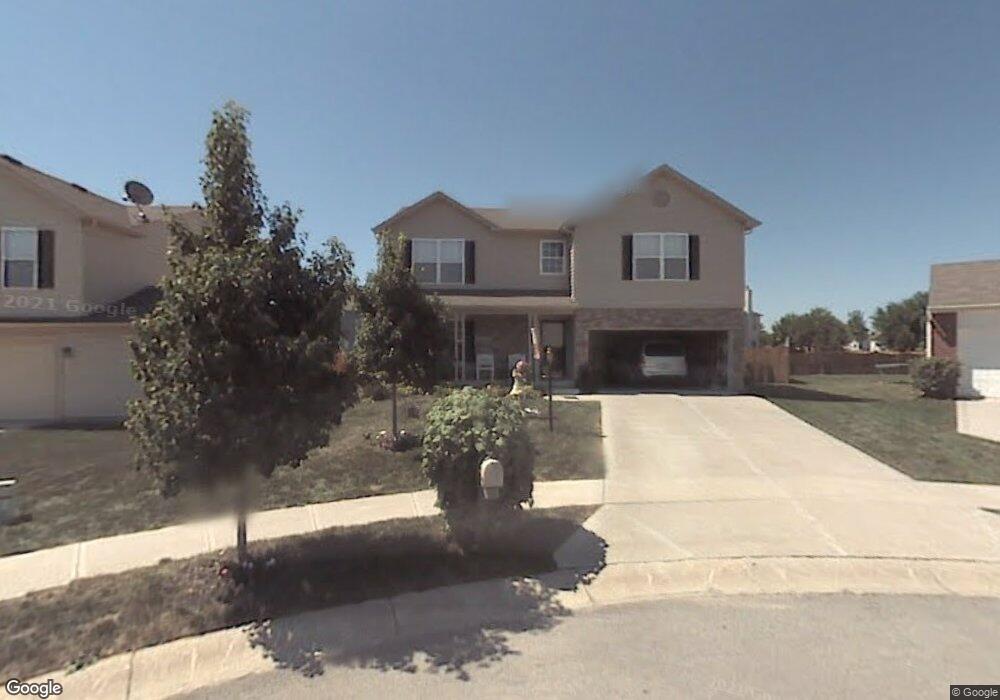
13592 Marlowe Ct Fishers, IN 46038
Estimated Value: $409,030 - $438,000
4
Beds
3
Baths
2,332
Sq Ft
$180/Sq Ft
Est. Value
About This Home
This home is located at 13592 Marlowe Ct, Fishers, IN 46038 and is currently estimated at $420,508, approximately $180 per square foot. 13592 Marlowe Ct is a home located in Hamilton County with nearby schools including Cumberland Road Elementary School, East Middle School, and Fishers Junior High School.
Ownership History
Date
Name
Owned For
Owner Type
Purchase Details
Closed on
Mar 23, 2021
Sold by
Kalustian David D and Kalustian Deborah
Bought by
Kellogg Norman and Kellogg Kathryn
Current Estimated Value
Home Financials for this Owner
Home Financials are based on the most recent Mortgage that was taken out on this home.
Original Mortgage
$185,000
Outstanding Balance
$166,396
Interest Rate
2.9%
Mortgage Type
New Conventional
Estimated Equity
$254,112
Purchase Details
Closed on
Mar 8, 2004
Sold by
Trinity Homes Llc
Bought by
Williamson John and Williamson Carol
Home Financials for this Owner
Home Financials are based on the most recent Mortgage that was taken out on this home.
Original Mortgage
$126,450
Interest Rate
5.77%
Mortgage Type
Purchase Money Mortgage
Purchase Details
Closed on
Sep 23, 2003
Sold by
Sweet Briar Development Llc
Bought by
Trinity Homes Llc
Create a Home Valuation Report for This Property
The Home Valuation Report is an in-depth analysis detailing your home's value as well as a comparison with similar homes in the area
Home Values in the Area
Average Home Value in this Area
Purchase History
| Date | Buyer | Sale Price | Title Company |
|---|---|---|---|
| Kellogg Norman | $335,000 | None Available | |
| Williamson John | -- | -- | |
| Trinity Homes Llc | -- | -- |
Source: Public Records
Mortgage History
| Date | Status | Borrower | Loan Amount |
|---|---|---|---|
| Open | Kellogg Norman | $185,000 | |
| Previous Owner | Williamson John | $126,450 |
Source: Public Records
Tax History Compared to Growth
Tax History
| Year | Tax Paid | Tax Assessment Tax Assessment Total Assessment is a certain percentage of the fair market value that is determined by local assessors to be the total taxable value of land and additions on the property. | Land | Improvement |
|---|---|---|---|---|
| 2024 | $4,016 | $370,900 | $44,700 | $326,200 |
| 2023 | $4,051 | $356,900 | $44,700 | $312,200 |
| 2022 | $2,972 | $304,500 | $44,700 | $259,800 |
| 2021 | $2,972 | $249,900 | $44,700 | $205,200 |
| 2020 | $2,922 | $245,000 | $44,700 | $200,300 |
| 2019 | $2,756 | $231,600 | $36,400 | $195,200 |
| 2018 | $2,488 | $211,100 | $36,400 | $174,700 |
| 2017 | $2,318 | $206,100 | $36,400 | $169,700 |
| 2016 | $2,202 | $199,200 | $36,400 | $162,800 |
| 2014 | $1,889 | $185,800 | $38,300 | $147,500 |
| 2013 | $1,889 | $184,300 | $38,300 | $146,000 |
Source: Public Records
Map
Nearby Homes
- 10093 Parkshore Dr
- 10175 Pamona Ct
- 10523 Hollowood Ct
- 10150 Beresford Ct
- 13763 Meadow Lake Dr
- 10055 Plantana Blvd
- 9887 Cranberry Cir
- 13853 Oak Grove Ct
- 14041 Mimosa Ct
- 13125 Zinfandel Place
- 13068 Lamarque Place
- 11798 & 11842 E 131st St
- 10343 Waveland Cir
- 13854 Meadow Grass Way
- 10414 Bicknell Cir
- 13048 Ross Crossing
- 10270 Apple Blossom Cir
- 10190 Holly Berry Cir
- 9984 Gentry Dr
- 12991 Wingstem Ct
- 13586 Marlowe Ct
- 13594 Marlowe Ct
- 10126 Stockwell Dr
- 10130 Stockwell Dr
- 13582 Marlowe Ct
- 10122 Stockwell Dr
- 13596 Marlowe Ct
- 10140 Stockwell Dr
- 13576 Marlowe Ct
- 13587 Marlowe Ct
- 13593 Marlowe Ct
- 13597 Marlowe Ct
- 10118 Stockwell Dr
- 13583 Marlowe Ct
- 13577 Marlowe Ct
- 10125 Stockwell Dr
- 10164 Water Crest Dr
- 13594 Sweet Briar Pkwy
- 10121 Stockwell Dr
- 10184 Water Crest Dr