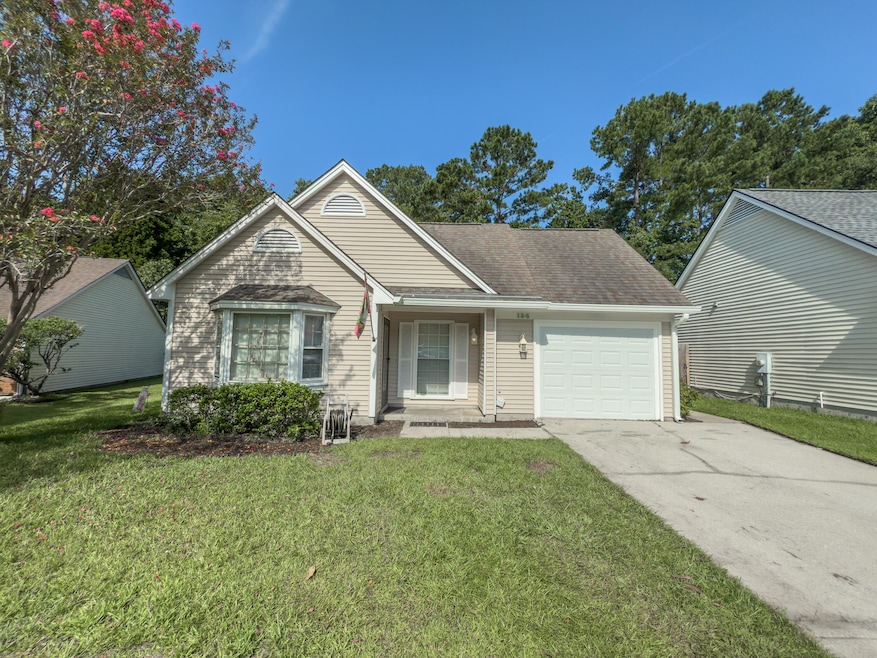


136 Alston Cir Goose Creek, SC 29445
Highlights
- Golf Course Community
- High Ceiling
- Central Air
- Traditional Architecture
- Community Pool
- Ceiling Fan
About This Home
Beautiful home in Crowfield neighborhood. LVP flooring in living areas, garage converted to step down den. Vaulted ceilings, nice Privacy fenced back yark. There is shed in back for extra storage. There is an app fee of $60.00 per person over the age of 18 living in home. An admin fee of $150.00 will be collected at lease signing. If sq ft and schools are important please verify
Home Details
Home Type
- Single Family
Est. Annual Taxes
- $917
Year Built
- Built in 1986
Lot Details
- Privacy Fence
Parking
- Off-Street Parking
Home Design
- Traditional Architecture
Interior Spaces
- 1,327 Sq Ft Home
- 1-Story Property
- High Ceiling
- Ceiling Fan
- Window Treatments
- Family Room
- Living Room with Fireplace
- Carpet
Kitchen
- Electric Range
- Dishwasher
Bedrooms and Bathrooms
- 3 Bedrooms
- 2 Full Bathrooms
Laundry
- Dryer
- Washer
Schools
- Westview Elementary And Middle School
- Stratford High School
Utilities
- Central Air
- Heat Pump System
Listing and Financial Details
- Property Available on 8/1/25
- 12 Month Lease Term
Community Details
Overview
- Crowfield Plantation Subdivision
Recreation
- Golf Course Community
- Community Pool
- Trails
Map
Source: CHS Regional MLS
MLS Number: 25020153
APN: 243-03-09-018
Disclaimer: Certain information contained herein is derived from information provided by parties other than Homes.com. All information provided is deemed reliable, but is not guaranteed to be accurate and should be independently verified.
![]() The information is being provided by Charleston Trident MLS. Information deemed reliable but not guaranteed. Information is provided for consumers' personal, non-commercial use, and may not be used for any purpose other than the identification of potential properties for purchase. © 2025 Charleston Trident MLS. All Rights Reserved
The information is being provided by Charleston Trident MLS. Information deemed reliable but not guaranteed. Information is provided for consumers' personal, non-commercial use, and may not be used for any purpose other than the identification of potential properties for purchase. © 2025 Charleston Trident MLS. All Rights Reserved
- 108 Shropshire St
- 18 Rudwick Cir Unit 18
- 130 Shropshire St
- 19 Rudwick Cir Unit 19
- 216 Holly Ave
- 108 Williamsburg Ct
- 111 Downing Ct
- 201 Commons Way
- 414 Birch Ave
- 105 Commons Way
- 117 Berringer Dr
- 301 Farm Rd
- 39 Indigo Ln
- 18 Indigo Ln
- 100 Lexington Place
- 103 Saxton Ct
- 102 Lexington Place
- 208 Janice St
- 58 Indigo Ln
- 115 Foxborough Rd
- 101 Bridgetown Rd
- 105 Queens Ct
- 121 Durham Dr
- 202 St James Ave
- 121 Cherry Hill Ave
- 110 Farm Rd Unit B
- 110 Farm Rd Unit A
- 105 Farm Rd
- 102 Six Point Ct
- 200 Branchwood Dr
- 144 Carol Dr
- 130 Carol Dr
- 112 Woodbine Rd
- 104 Roxanne Dr
- 107 Spalding Cir
- 414 Hamlet Cir
- 102 Adthan Cir
- 2605 Elms Plantation Blvd
- 138 Adthan Cir
- 2510 Atlantic Palms Ln
