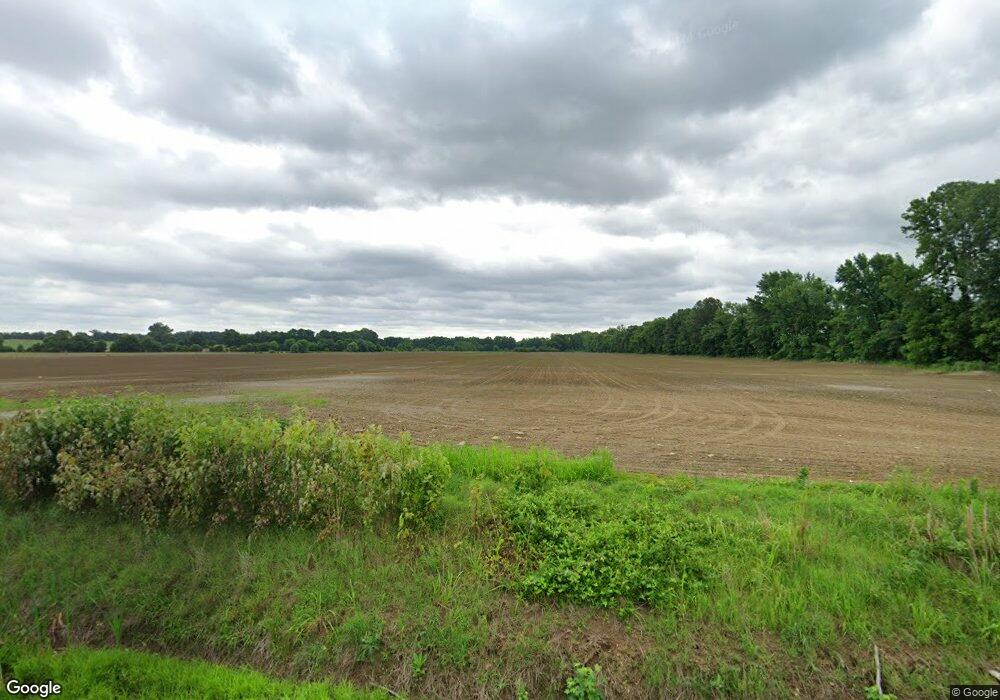
136 Bob Craig Rd Kenton, TN 38233
Estimated Value: $100,110 - $107,000
--
Bed
1
Bath
1,189
Sq Ft
$87/Sq Ft
Est. Value
About This Home
This home is located at 136 Bob Craig Rd, Kenton, TN 38233 and is currently estimated at $103,555, approximately $87 per square foot. 136 Bob Craig Rd is a home located in Gibson County with nearby schools including Rutherford Elementary School and Gibson County High School.
Ownership History
Date
Name
Owned For
Owner Type
Purchase Details
Closed on
Jul 17, 2024
Sold by
Grant Kellea
Bought by
Grant David Wayne
Current Estimated Value
Purchase Details
Closed on
Aug 25, 2023
Sold by
Grant David Wayne
Bought by
Grant Kellea
Purchase Details
Closed on
Apr 21, 2023
Sold by
Wayne Houston Grant Credit Shelter Trust
Bought by
Grant David Wayne and Kobes Christy Grant
Purchase Details
Closed on
Apr 28, 2021
Sold by
Jewell Deborah Ann and Duly Jonathan Jewell
Bought by
Mallard Valley Land Co Llc
Purchase Details
Closed on
Apr 12, 2008
Sold by
Jewell Jonathan
Bought by
Jewell Deborah Ann
Purchase Details
Closed on
Oct 19, 2007
Sold by
Jewell James Jonathan
Bought by
Jewell Jonathan
Purchase Details
Closed on
Oct 13, 2007
Sold by
Jewell James Jonathan
Bought by
Jewell Jonathan
Purchase Details
Closed on
May 11, 1998
Sold by
Martin Charlotte
Bought by
Jewell James
Purchase Details
Closed on
Jan 24, 1949
Bought by
Corley Corley P and Corley Vera
Create a Home Valuation Report for This Property
The Home Valuation Report is an in-depth analysis detailing your home's value as well as a comparison with similar homes in the area
Home Values in the Area
Average Home Value in this Area
Purchase History
| Date | Buyer | Sale Price | Title Company |
|---|---|---|---|
| Grant David Wayne | -- | None Listed On Document | |
| Grant Kellea | -- | None Listed On Document | |
| Grant David Wayne | -- | None Listed On Document | |
| Mallard Valley Land Co Llc | $21,325 | None Available | |
| Jewell Deborah Ann | -- | -- | |
| Jewell Jonathan | -- | -- | |
| Jewell Jonathan | -- | -- | |
| Jewell James | $26,500 | -- | |
| Corley Corley P | -- | -- |
Source: Public Records
Tax History Compared to Growth
Tax History
| Year | Tax Paid | Tax Assessment Tax Assessment Total Assessment is a certain percentage of the fair market value that is determined by local assessors to be the total taxable value of land and additions on the property. | Land | Improvement |
|---|---|---|---|---|
| 2024 | $99 | $4,100 | $4,100 | $0 |
| 2023 | $84 | $2,400 | $2,400 | $0 |
| 2022 | $83 | $2,400 | $2,400 | $0 |
| 2021 | $202 | $3,125 | $2,400 | $725 |
| 2020 | $332 | $9,625 | $2,400 | $7,225 |
| 2019 | $329 | $9,625 | $2,400 | $7,225 |
| 2018 | $334 | $9,375 | $2,400 | $6,975 |
| 2017 | $330 | $9,375 | $2,400 | $6,975 |
| 2016 | $330 | $9,375 | $2,400 | $6,975 |
| 2015 | $289 | $9,375 | $2,400 | $6,975 |
| 2014 | $289 | $9,375 | $2,400 | $6,975 |
Source: Public Records
Map
Nearby Homes
- 111 Old Rutherford Kenton Rd
- 944 Mcknight St
- 109 Smith Ave
- 407 Fain St
- 61 Con Pennington Rd
- 209 Hillside St
- 624 W Main St
- 507 Tilghman St
- 204 Flowers St
- 511 W Knox St
- 403 W Knox St
- 321 W Main St
- 404 Mcknight St
- 101 N Front St
- 614 E Church St
- 130 Callis Dr
- 113 Mcknight St
- 112 Fox St
- 502 E Main St
- 107 Hopper St
