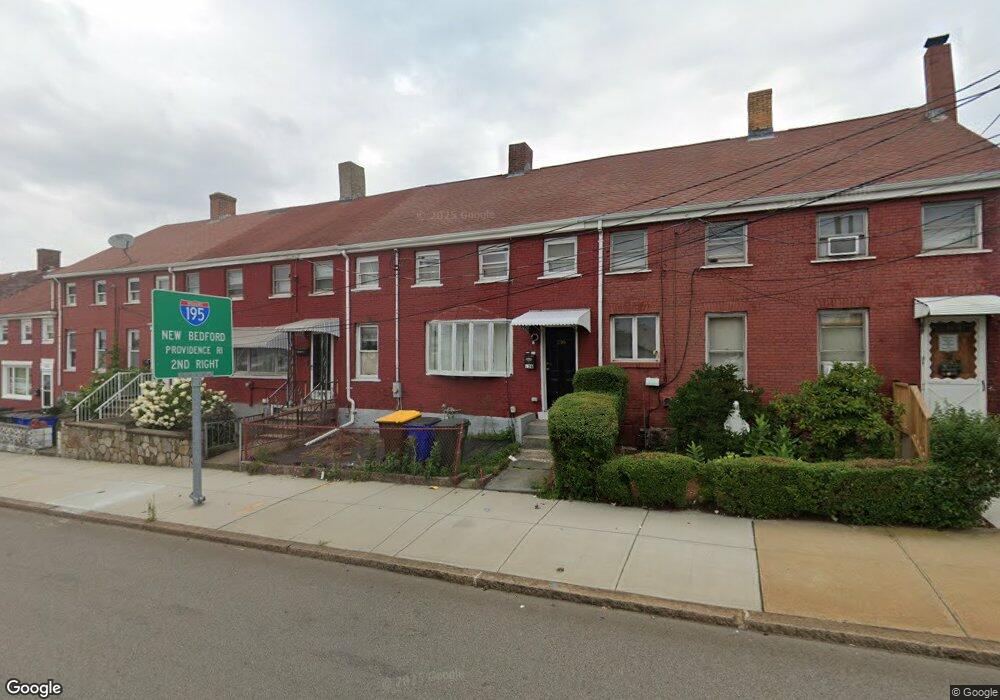
136 Broadway Fall River, MA 02721
Sandy Beach NeighborhoodEstimated Value: $287,000 - $348,000
4
Beds
1
Bath
1,188
Sq Ft
$264/Sq Ft
Est. Value
About This Home
This home is located at 136 Broadway, Fall River, MA 02721 and is currently estimated at $313,251, approximately $263 per square foot. 136 Broadway is a home located in Bristol County with nearby schools including John J. Doran Community School, Matthew J. Kuss Middle School, and B M C Durfee High School.
Ownership History
Date
Name
Owned For
Owner Type
Purchase Details
Closed on
Jan 29, 2008
Sold by
Hsbc Mortgage Svcs Inc
Bought by
Brogan Russell A
Current Estimated Value
Home Financials for this Owner
Home Financials are based on the most recent Mortgage that was taken out on this home.
Original Mortgage
$84,700
Outstanding Balance
$53,733
Interest Rate
6.17%
Mortgage Type
Purchase Money Mortgage
Estimated Equity
$259,518
Purchase Details
Closed on
Jul 12, 2007
Sold by
Sousa Jennifer E
Bought by
Hsbc Mortgage Svcs Inc
Purchase Details
Closed on
Aug 1, 2003
Sold by
Trottier Madeline
Bought by
Sousa Jennifer E
Home Financials for this Owner
Home Financials are based on the most recent Mortgage that was taken out on this home.
Original Mortgage
$101,250
Interest Rate
5.28%
Mortgage Type
Purchase Money Mortgage
Create a Home Valuation Report for This Property
The Home Valuation Report is an in-depth analysis detailing your home's value as well as a comparison with similar homes in the area
Home Values in the Area
Average Home Value in this Area
Purchase History
| Date | Buyer | Sale Price | Title Company |
|---|---|---|---|
| Brogan Russell A | $110,000 | -- | |
| Hsbc Mortgage Svcs Inc | $179,429 | -- | |
| Sousa Jennifer E | $135,000 | -- |
Source: Public Records
Mortgage History
| Date | Status | Borrower | Loan Amount |
|---|---|---|---|
| Open | Brogan Russell A | $84,700 | |
| Previous Owner | Sousa Jennifer E | $151,500 | |
| Previous Owner | Sousa Jennifer E | $128,250 | |
| Previous Owner | Sousa Jennifer E | $101,250 |
Source: Public Records
Tax History
| Year | Tax Paid | Tax Assessment Tax Assessment Total Assessment is a certain percentage of the fair market value that is determined by local assessors to be the total taxable value of land and additions on the property. | Land | Improvement |
|---|---|---|---|---|
| 2025 | $2,403 | $209,900 | $105,500 | $104,400 |
| 2024 | $2,358 | $205,200 | $101,600 | $103,600 |
| 2023 | $2,169 | $176,800 | $83,900 | $92,900 |
| 2022 | $2,181 | $172,800 | $79,900 | $92,900 |
| 2021 | $2,026 | $146,500 | $76,000 | $70,500 |
| 2020 | $2,042 | $141,300 | $74,900 | $66,400 |
| 2019 | $2,149 | $147,400 | $72,200 | $75,200 |
| 2018 | $2,339 | $160,000 | $78,200 | $81,800 |
| 2017 | $2,188 | $156,300 | $74,500 | $81,800 |
| 2016 | $2,196 | $161,100 | $79,300 | $81,800 |
| 2015 | $2,160 | $165,100 | $79,300 | $85,800 |
| 2014 | $2,029 | $161,300 | $76,900 | $84,400 |
Source: Public Records
Map
Nearby Homes
- 330 William St
- 315 William St
- 327 William St
- 271 Mulberry St
- 403 Division St Unit 13
- 403 Division St Unit 5
- 403 Division St Unit 9
- 403 Division St Unit 11
- 403 Division St Unit 12
- 403 Division St Unit 1
- 403 Division St Unit 18
- 303 Eagle St Unit C
- 302 Hope St
- 420 Bradford Ave
- 334 Fountain St
- 169 Grant St
- 165 Grant St
- 75 Hunter St
- 77 Hunter St
- 141 Hunter St
Your Personal Tour Guide
Ask me questions while you tour the home.