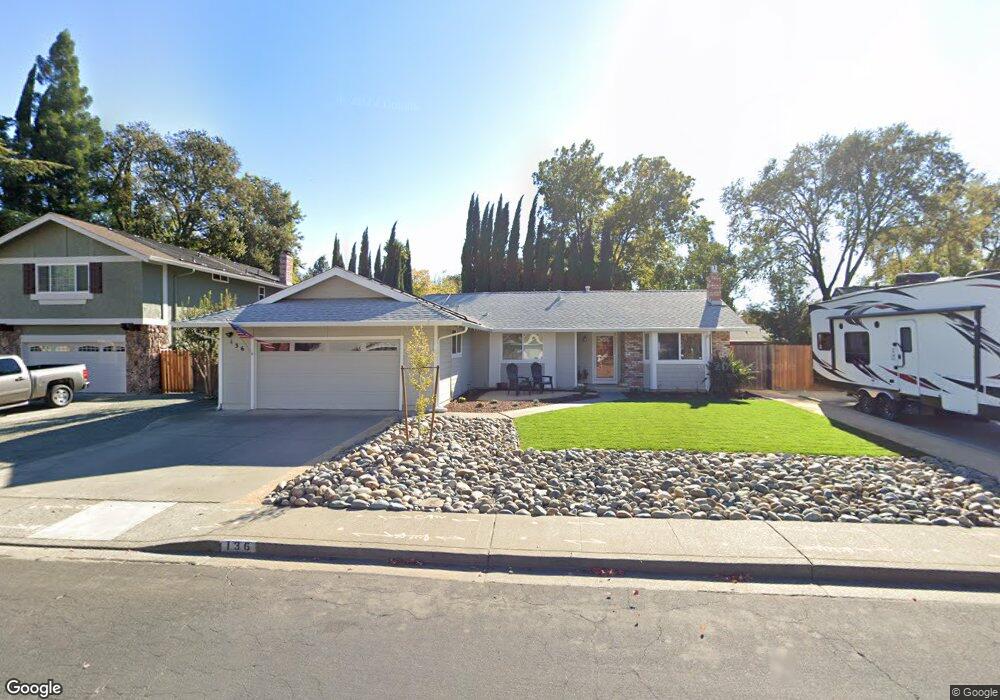
136 Cheyenne Dr Vacaville, CA 95688
Estimated Value: $598,200 - $685,000
3
Beds
2
Baths
1,540
Sq Ft
$419/Sq Ft
Est. Value
About This Home
This home is located at 136 Cheyenne Dr, Vacaville, CA 95688 and is currently estimated at $644,550, approximately $418 per square foot. 136 Cheyenne Dr is a home located in Solano County with nearby schools including Alamo Elementary School, Orchard Elementary School, and Willis Jepson Middle School.
Ownership History
Date
Name
Owned For
Owner Type
Purchase Details
Closed on
Apr 10, 2021
Sold by
Costigan Chad and Costigan Melissa
Bought by
Costigan Chad and Costigan Melissa
Current Estimated Value
Home Financials for this Owner
Home Financials are based on the most recent Mortgage that was taken out on this home.
Original Mortgage
$455,200
Outstanding Balance
$407,410
Interest Rate
3%
Mortgage Type
New Conventional
Estimated Equity
$237,140
Purchase Details
Closed on
Sep 16, 2014
Sold by
Cannon Clarence H and Cannon Mary T
Bought by
Costigan Chad W and Costigan Melissa L
Home Financials for this Owner
Home Financials are based on the most recent Mortgage that was taken out on this home.
Original Mortgage
$397,664
Interest Rate
4.1%
Mortgage Type
FHA
Purchase Details
Closed on
Sep 17, 1997
Sold by
Charette Mary T and Charette Mary T
Bought by
Cannon Clarence H and Cannon Mary T
Create a Home Valuation Report for This Property
The Home Valuation Report is an in-depth analysis detailing your home's value as well as a comparison with similar homes in the area
Purchase History
| Date | Buyer | Sale Price | Title Company |
|---|---|---|---|
| Costigan Chad | -- | Old Republic Title Company | |
| Costigan Chad W | $405,000 | Fidelity National Title Co | |
| Cannon Clarence H | -- | -- |
Source: Public Records
Mortgage History
| Date | Status | Borrower | Loan Amount |
|---|---|---|---|
| Open | Costigan Chad | $455,200 | |
| Closed | Costigan Chad W | $397,664 |
Source: Public Records
Tax History
| Year | Tax Paid | Tax Assessment Tax Assessment Total Assessment is a certain percentage of the fair market value that is determined by local assessors to be the total taxable value of land and additions on the property. | Land | Improvement |
|---|---|---|---|---|
| 2025 | $5,598 | $486,740 | $150,226 | $336,514 |
| 2024 | $5,598 | $477,197 | $147,281 | $329,916 |
| 2023 | $5,546 | $467,842 | $144,394 | $323,448 |
| 2022 | $5,401 | $458,669 | $141,563 | $317,106 |
| 2021 | $5,409 | $449,677 | $138,788 | $310,889 |
| 2020 | $5,336 | $445,067 | $137,365 | $307,702 |
| 2019 | $5,243 | $436,341 | $134,672 | $301,669 |
| 2018 | $7,733 | $427,786 | $132,032 | $295,754 |
| 2017 | $7,541 | $419,399 | $129,444 | $289,955 |
| 2016 | $4,988 | $411,176 | $126,906 | $284,270 |
| 2015 | $4,923 | $405,000 | $125,000 | $280,000 |
| 2014 | $2,236 | $189,639 | $51,720 | $137,919 |
Source: Public Records
Map
Nearby Homes
- 179 Cheyenne Dr
- 162 N Alamo Dr
- 104 Westwood St
- 173 San Jose Ct
- 692 Linwood St
- 729 Brookside Dr
- 179 Wykoff Dr
- 124 Wykoff Dr
- 317 N Alamo Dr
- 160 Wykoff Dr
- 215 Wykoff Dr
- 591 Arlene Dr
- 700 Shady Glen Ave Unit 24
- 3042 Vasquez Ct
- 365 Acacia St
- 220 Hidden Valley Ln
- 938 Fruit Stand Cir
- 345 Eldridge Ave
- 240 Hidden Valley Ln
- 308 Buckeye St
Your Personal Tour Guide
Ask me questions while you tour the home.