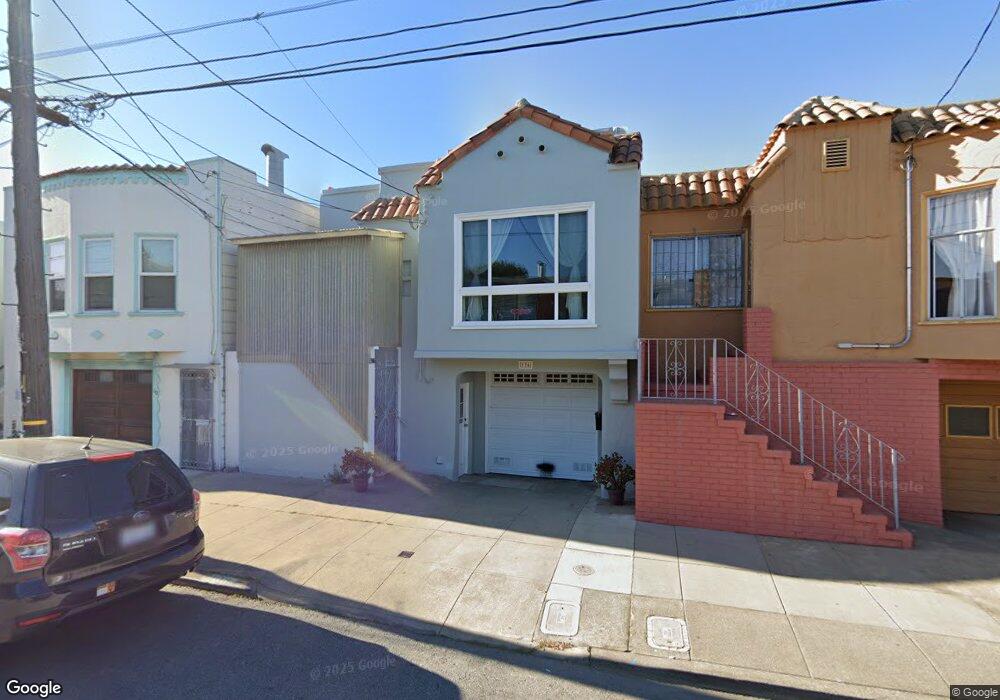
136 Del Monte St San Francisco, CA 94112
Outer Mission NeighborhoodEstimated Value: $962,000 - $1,262,000
2
Beds
1
Bath
1,100
Sq Ft
$1,054/Sq Ft
Est. Value
About This Home
This home is located at 136 Del Monte St, San Francisco, CA 94112 and is currently estimated at $1,159,709, approximately $1,054 per square foot. 136 Del Monte St is a home located in San Francisco County with nearby schools including Longfellow Elementary School, Denman (James) Middle School, and Leadership High School.
Ownership History
Date
Name
Owned For
Owner Type
Purchase Details
Closed on
Jul 9, 2019
Sold by
Lian Chun Yan
Bought by
Liang Chun Yan and Zheng Liang Family Trust
Current Estimated Value
Purchase Details
Closed on
Feb 23, 2012
Sold by
Liang Chun Yan and Zheng Peter Pei Qian
Bought by
Liang Chun Yan
Home Financials for this Owner
Home Financials are based on the most recent Mortgage that was taken out on this home.
Original Mortgage
$398,000
Outstanding Balance
$271,885
Interest Rate
3.83%
Mortgage Type
New Conventional
Estimated Equity
$887,824
Purchase Details
Closed on
Feb 4, 2009
Sold by
Grinsell Raymond
Bought by
Liang Karen Chun Yan
Home Financials for this Owner
Home Financials are based on the most recent Mortgage that was taken out on this home.
Original Mortgage
$417,000
Interest Rate
5.01%
Mortgage Type
Purchase Money Mortgage
Purchase Details
Closed on
Jan 13, 2009
Sold by
Tomas Francisco A and Tomas Magdalena C
Bought by
Grinsell Raymond
Home Financials for this Owner
Home Financials are based on the most recent Mortgage that was taken out on this home.
Original Mortgage
$417,000
Interest Rate
5.01%
Mortgage Type
Purchase Money Mortgage
Create a Home Valuation Report for This Property
The Home Valuation Report is an in-depth analysis detailing your home's value as well as a comparison with similar homes in the area
Home Values in the Area
Average Home Value in this Area
Purchase History
| Date | Buyer | Sale Price | Title Company |
|---|---|---|---|
| Liang Chun Yan | -- | None Available | |
| Liang Chun Yan | -- | First American Title Company | |
| Liang Karen Chun Yan | $530,000 | Fidelity National Title Co | |
| Grinsell Raymond | $402,300 | None Available |
Source: Public Records
Mortgage History
| Date | Status | Borrower | Loan Amount |
|---|---|---|---|
| Open | Liang Chun Yan | $398,000 | |
| Closed | Liang Karen Chun Yan | $417,000 |
Source: Public Records
Tax History Compared to Growth
Tax History
| Year | Tax Paid | Tax Assessment Tax Assessment Total Assessment is a certain percentage of the fair market value that is determined by local assessors to be the total taxable value of land and additions on the property. | Land | Improvement |
|---|---|---|---|---|
| 2025 | $9,594 | $766,647 | $553,732 | $212,915 |
| 2024 | $9,594 | $751,617 | $542,875 | $208,742 |
| 2023 | $9,444 | $736,881 | $532,231 | $204,650 |
| 2022 | $9,255 | $722,435 | $521,796 | $200,639 |
| 2021 | $9,089 | $708,271 | $511,565 | $196,706 |
| 2020 | $9,191 | $701,010 | $506,320 | $194,690 |
| 2019 | $8,831 | $687,267 | $496,393 | $190,874 |
| 2018 | $8,535 | $673,792 | $486,660 | $187,132 |
| 2017 | $8,136 | $660,581 | $477,118 | $183,463 |
| 2016 | $7,989 | $647,630 | $467,763 | $179,867 |
| 2015 | $7,889 | $637,904 | $460,737 | $177,167 |
| 2014 | $7,600 | $625,410 | $451,712 | $173,698 |
Source: Public Records
Map
Nearby Homes
- 86 Ellington Ave
- 5306-5308 Mission St
- 5284 Mission St
- 5254 Mission St
- 57 Niagara Ave
- 35 Guttenberg St
- 24 Rolph St
- 108 Naglee Ave
- 188 Pope St
- 841 Geneva Ave
- 2 Byron Ct
- 5020 Mission St Unit 1
- 1118 Geneva Ave
- 5698 Mission St
- 42 Farragut Ave
- 1125 Naples St
- 276 Seneca Ave
- 615 Mount Vernon Ave
- 2921 Alemany Blvd
- 658 Lisbon St
- 130 Del Monte St
- 124 Del Monte St
- 142 Del Monte St
- 148 Del Monte St
- 67 Mount Vernon Ave
- 63 Mount Vernon Ave
- 71 Mount Vernon Ave
- 59 Mount Vernon Ave
- 75 Mount Vernon Ave
- 154 Del Monte St
- 2421 Alemany Blvd
- 79 Mount Vernon Ave
- 2425 Alemany Blvd
- 160 Del Monte St
- 83 Mount Vernon Ave
- 2439 Alemany Blvd
- 55 Mount Vernon Ave
- 166 Del Monte St
- 2445 Alemany Blvd
- 125 Del Monte St