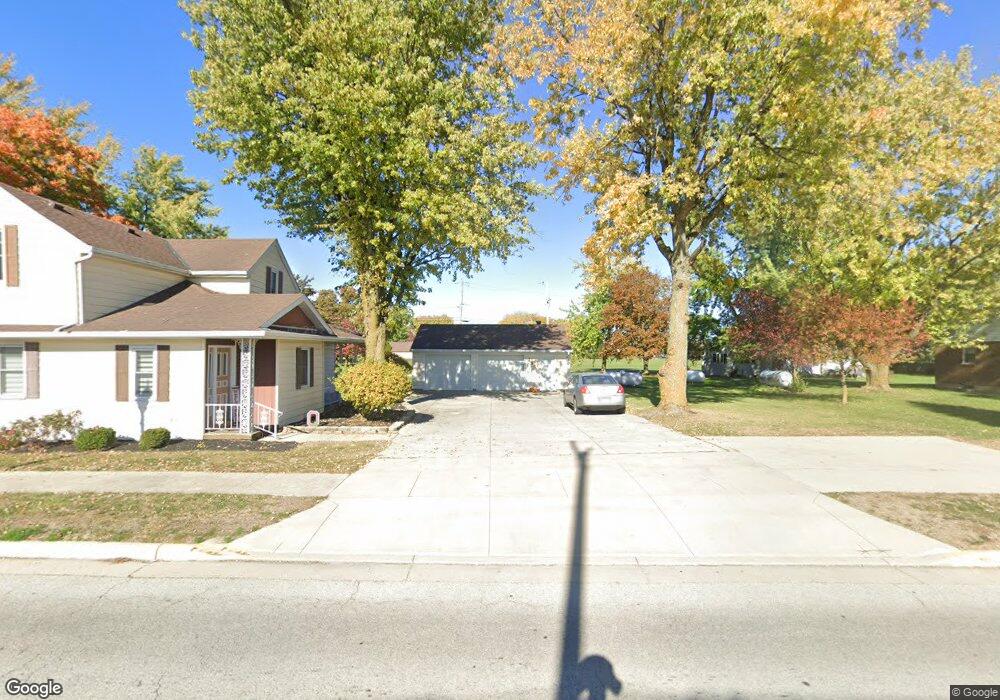
136 E Main St Osgood, OH 45351
Estimated Value: $285,000 - $436,000
4
Beds
2
Baths
1,770
Sq Ft
$193/Sq Ft
Est. Value
About This Home
This home is located at 136 E Main St, Osgood, OH 45351 and is currently estimated at $342,338, approximately $193 per square foot. 136 E Main St is a home with nearby schools including Marion Local Elementary School and Marion Local High School.
Ownership History
Date
Name
Owned For
Owner Type
Purchase Details
Closed on
Aug 12, 2025
Sold by
Wendel Reggie John
Bought by
Meier Grant L and Huelsman Jayden M
Current Estimated Value
Home Financials for this Owner
Home Financials are based on the most recent Mortgage that was taken out on this home.
Original Mortgage
$243,000
Outstanding Balance
$242,787
Interest Rate
6.67%
Mortgage Type
New Conventional
Estimated Equity
$99,551
Purchase Details
Closed on
Aug 3, 2018
Sold by
Schwieterman Joan and Wendel Randolph
Bought by
Wendel Reggie John
Home Financials for this Owner
Home Financials are based on the most recent Mortgage that was taken out on this home.
Original Mortgage
$75,200
Interest Rate
4.5%
Mortgage Type
New Conventional
Purchase Details
Closed on
Feb 5, 2018
Sold by
Magoteaux Hubert J
Bought by
Schwieterman Joan and Wendel Randolph
Create a Home Valuation Report for This Property
The Home Valuation Report is an in-depth analysis detailing your home's value as well as a comparison with similar homes in the area
Purchase History
| Date | Buyer | Sale Price | Title Company |
|---|---|---|---|
| Meier Grant L | $328,000 | None Listed On Document | |
| Wendel Reggie John | $94,000 | None Available | |
| Schwieterman Joan | -- | -- |
Source: Public Records
Mortgage History
| Date | Status | Borrower | Loan Amount |
|---|---|---|---|
| Open | Meier Grant L | $243,000 | |
| Previous Owner | Wendel Reggie John | $75,200 |
Source: Public Records
Tax History
| Year | Tax Paid | Tax Assessment Tax Assessment Total Assessment is a certain percentage of the fair market value that is determined by local assessors to be the total taxable value of land and additions on the property. | Land | Improvement |
|---|---|---|---|---|
| 2025 | $1,738 | $47,630 | $7,700 | $39,930 |
| 2024 | $1,738 | $47,630 | $7,700 | $39,930 |
| 2023 | $1,739 | $47,630 | $7,700 | $39,930 |
| 2022 | $1,482 | $39,620 | $6,550 | $33,070 |
| 2021 | $1,510 | $39,620 | $6,550 | $33,070 |
| 2020 | $1,514 | $39,620 | $6,550 | $33,070 |
| 2019 | $1,282 | $33,010 | $6,550 | $26,460 |
| 2018 | $983 | $33,010 | $6,550 | $26,460 |
| 2017 | $932 | $33,010 | $6,550 | $26,460 |
| 2016 | $918 | $31,860 | $6,550 | $25,310 |
| 2015 | $918 | $31,860 | $6,550 | $25,310 |
| 2014 | $920 | $31,860 | $6,550 | $25,310 |
| 2013 | $930 | $29,560 | $6,550 | $23,010 |
Source: Public Records
Map
Nearby Homes
Your Personal Tour Guide
Ask me questions while you tour the home.