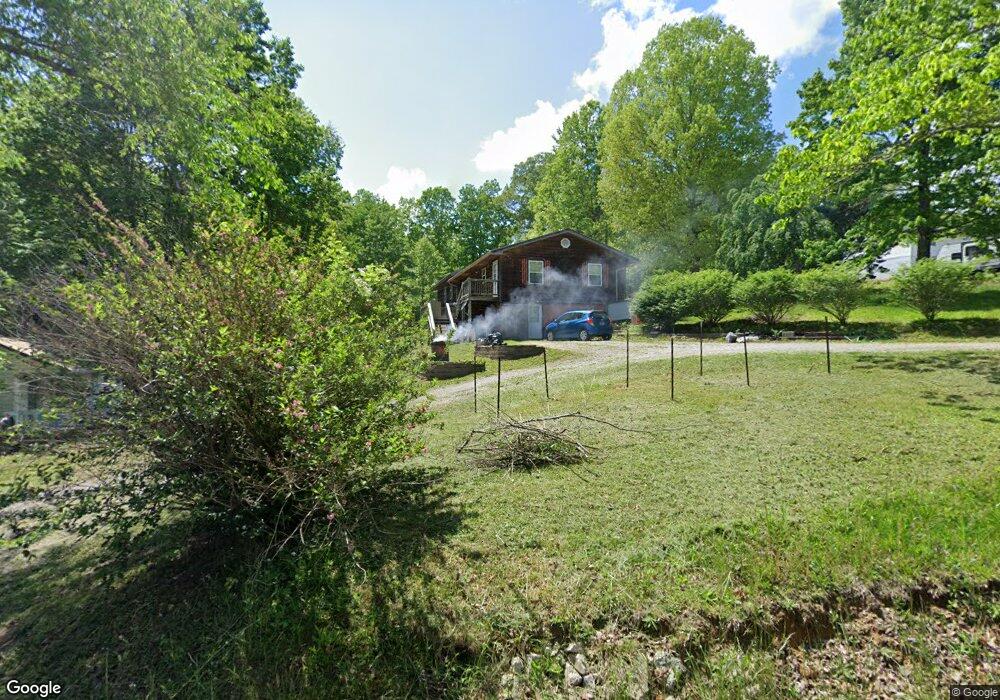
136 Eastwind Ln Jamestown, TN 38556
Estimated Value: $182,000 - $274,860
--
Bed
1
Bath
1,876
Sq Ft
$122/Sq Ft
Est. Value
About This Home
This home is located at 136 Eastwind Ln, Jamestown, TN 38556 and is currently estimated at $228,715, approximately $121 per square foot. 136 Eastwind Ln is a home located in Fentress County.
Ownership History
Date
Name
Owned For
Owner Type
Purchase Details
Closed on
Nov 13, 2023
Sold by
Wanegar Paul and Wanegar Ann Marie
Bought by
Tucker Terri and Bradley Ashley
Current Estimated Value
Home Financials for this Owner
Home Financials are based on the most recent Mortgage that was taken out on this home.
Original Mortgage
$207,070
Outstanding Balance
$203,274
Interest Rate
7.49%
Mortgage Type
New Conventional
Estimated Equity
$25,441
Purchase Details
Closed on
May 20, 2020
Sold by
Asberry Charles and Asberry Melissa Jo
Bought by
Wanegar Paul and Wanegar Ann Marie
Home Financials for this Owner
Home Financials are based on the most recent Mortgage that was taken out on this home.
Original Mortgage
$18,666
Interest Rate
3.3%
Mortgage Type
VA
Purchase Details
Closed on
Feb 15, 1994
Bought by
Asberry Charles W
Purchase Details
Closed on
Sep 24, 1990
Bought by
Snell Dwight J Elma L
Purchase Details
Closed on
Jan 3, 1989
Bought by
Brown Michael E Betty
Create a Home Valuation Report for This Property
The Home Valuation Report is an in-depth analysis detailing your home's value as well as a comparison with similar homes in the area
Home Values in the Area
Average Home Value in this Area
Purchase History
| Date | Buyer | Sale Price | Title Company |
|---|---|---|---|
| Tucker Terri | $205,000 | Integrity Title | |
| Wanegar Paul | $116,000 | None Available | |
| Asberry Charles W | $27,000 | -- | |
| Snell Dwight J Elma L | $33,000 | -- | |
| Brown Michael E Betty | $32,500 | -- |
Source: Public Records
Mortgage History
| Date | Status | Borrower | Loan Amount |
|---|---|---|---|
| Open | Tucker Terri | $207,070 | |
| Previous Owner | Wanegar Paul | $18,666 |
Source: Public Records
Tax History Compared to Growth
Tax History
| Year | Tax Paid | Tax Assessment Tax Assessment Total Assessment is a certain percentage of the fair market value that is determined by local assessors to be the total taxable value of land and additions on the property. | Land | Improvement |
|---|---|---|---|---|
| 2025 | $609 | $45,125 | $0 | $0 |
| 2024 | $609 | $45,125 | $4,525 | $40,600 |
| 2023 | $612 | $45,325 | $4,725 | $40,600 |
| 2022 | $520 | $27,200 | $4,500 | $22,700 |
| 2021 | $520 | $27,200 | $4,500 | $22,700 |
| 2020 | $491 | $25,700 | $3,000 | $22,700 |
| 2019 | $491 | $25,700 | $3,000 | $22,700 |
| 2018 | $491 | $25,700 | $3,000 | $22,700 |
| 2017 | $515 | $25,950 | $3,000 | $22,950 |
| 2016 | $515 | $25,950 | $3,000 | $22,950 |
| 2015 | $515 | $25,936 | $0 | $0 |
| 2014 | $515 | $25,936 | $0 | $0 |
Source: Public Records
Map
Nearby Homes
- 299 Fair Oaks Ln
- 1119 Nichol Creek Dr
- n/a Northwood Place
- 0 Northwood Place
- 114 Canter Ln
- 158 Northwood Dr
- 55 Canter Ln
- 2110 Pickett Park Hwy
- 788 Vista View Pkwy
- 122 Canter Ln
- 1019 Sunshine Estates Rd
- 2122 Pickett Park Hwy
- 280 Joe Barnett Rd
- 838 Slaven Ridge Rd
- 205 Maggie Valley Dr
- 0 Slaven Ridge Rd Unit 1299497
- 355 Joe Barnett Rd
- 702 Iris Ave
- 419 Tulip Ave
- 0 Pickett Park Hwy Unit 1296019
- 136 Eastwind Ln
- 133 Windcrest Dr
- 145 Eastwind Ln
- 0 E Wind Ln Unit 653779
- 0 E Wind Ln Unit 653780
- 0 E Wind Ln Unit 896315
- 0 E Wind Ln Unit 895920
- 0 E Wind Ln Unit 895921
- 0 E Wind Ln Unit 896033
- 0 E Wind Ln Unit 895918
- 136 Windcrest Dr
- 127 Windcrest Dr
- 127 Eastwind Ln
- 148 Windcrest Dr
- 124 Windcrest Dr
- 212 Southwind Ln
- 120 Slumber Rd
- 825 Sleepy Hollow Rd
- 121 Windcrest Dr
- 287 Crouch Ln