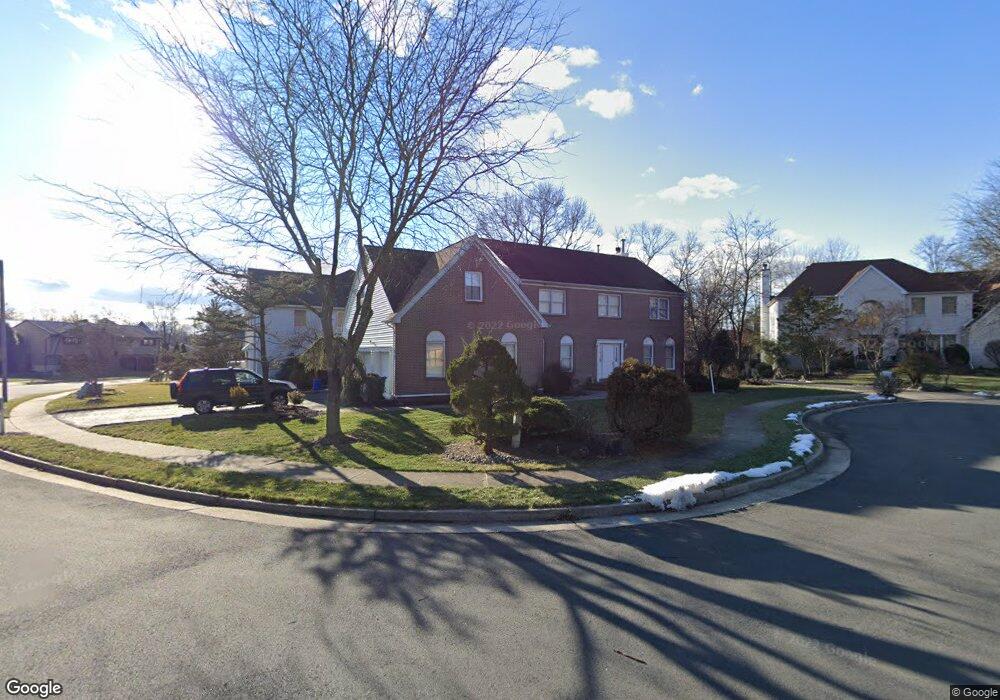
136 Edison Ave Edison, NJ 08820
Estimated Value: $929,000 - $1,325,000
Studio
--
Bath
3,247
Sq Ft
$354/Sq Ft
Est. Value
About This Home
This home is located at 136 Edison Ave, Edison, NJ 08820 and is currently estimated at $1,149,074, approximately $353 per square foot. 136 Edison Ave is a home located in Middlesex County with nearby schools including Menlo Park Elementary School, Woodrow Wilson Middle School, and J.P. Stevens High School.
Ownership History
Date
Name
Owned For
Owner Type
Purchase Details
Closed on
Apr 13, 1994
Sold by
Edgewood Prop Inc
Bought by
Girawong Akom and Girawong Veeradu
Current Estimated Value
Home Financials for this Owner
Home Financials are based on the most recent Mortgage that was taken out on this home.
Original Mortgage
$150,000
Interest Rate
7.7%
Purchase Details
Closed on
Apr 8, 1994
Sold by
Washington Plaza Assoc
Bought by
Edgewood Properties
Home Financials for this Owner
Home Financials are based on the most recent Mortgage that was taken out on this home.
Original Mortgage
$150,000
Interest Rate
7.7%
Create a Home Valuation Report for This Property
The Home Valuation Report is an in-depth analysis detailing your home's value as well as a comparison with similar homes in the area
Home Values in the Area
Average Home Value in this Area
Purchase History
| Date | Buyer | Sale Price | Title Company |
|---|---|---|---|
| Girawong Akom | $385,000 | -- | |
| Edgewood Properties | $69,755 | -- |
Source: Public Records
Mortgage History
| Date | Status | Borrower | Loan Amount |
|---|---|---|---|
| Previous Owner | Girawong Akom | $150,000 |
Source: Public Records
Tax History
| Year | Tax Paid | Tax Assessment Tax Assessment Total Assessment is a certain percentage of the fair market value that is determined by local assessors to be the total taxable value of land and additions on the property. | Land | Improvement |
|---|---|---|---|---|
| 2025 | $22,324 | $375,000 | $96,000 | $279,000 |
| 2024 | $22,204 | $375,000 | $96,000 | $279,000 |
Source: Public Records
Map
Nearby Homes
- 51 Adams St
- 177 Mundy Ave
- 73 Christie St
- 182 Parsonage Rd
- 1821 Oak Tree Rd
- 27 Mason Dr
- 48 Lynnwood Rd
- 1868 Oak Tree Rd
- 25 Beverly Ct
- 21 Middlesex Ave
- 3 Hummingbird Ln
- 12 Edgewood Rd
- 188 E Chestnut Ave
- 9 Links Dr
- 51 Linden Ave
- 65 Willow Rd
- 265 Plainfield Rd
- 122 Spear St
- 33 Nottingham Rd
- 46 Plainfield Ave
Your Personal Tour Guide
Ask me questions while you tour the home.