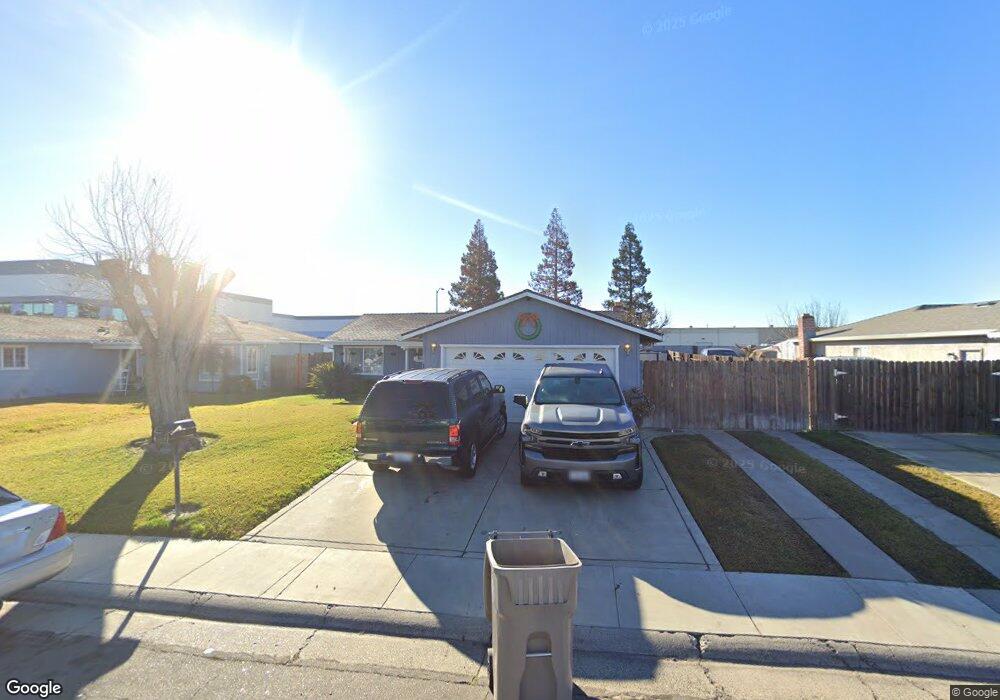
136 Estes Way Sacramento, CA 95838
Glenwood Meadows NeighborhoodEstimated Value: $396,695 - $441,000
3
Beds
2
Baths
1,134
Sq Ft
$367/Sq Ft
Est. Value
About This Home
This home is located at 136 Estes Way, Sacramento, CA 95838 and is currently estimated at $416,174, approximately $366 per square foot. 136 Estes Way is a home located in Sacramento County with nearby schools including Glenwood Elementary School, Rio Linda Preparatory Academy, and Norwood Junior High School.
Ownership History
Date
Name
Owned For
Owner Type
Purchase Details
Closed on
Sep 27, 2023
Sold by
Unknown
Bought by
Allen Orlando Carruth Living Trust and Carruth
Current Estimated Value
Purchase Details
Closed on
Nov 26, 2012
Sold by
Carruth Claire Jean
Bought by
Carruth Allen O
Home Financials for this Owner
Home Financials are based on the most recent Mortgage that was taken out on this home.
Original Mortgage
$140,600
Interest Rate
3.54%
Mortgage Type
New Conventional
Purchase Details
Closed on
Sep 17, 1998
Sold by
Carruth Allen O
Bought by
Carruth Allen O
Home Financials for this Owner
Home Financials are based on the most recent Mortgage that was taken out on this home.
Original Mortgage
$25,000
Interest Rate
6.88%
Mortgage Type
Stand Alone Second
Create a Home Valuation Report for This Property
The Home Valuation Report is an in-depth analysis detailing your home's value as well as a comparison with similar homes in the area
Home Values in the Area
Average Home Value in this Area
Purchase History
| Date | Buyer | Sale Price | Title Company |
|---|---|---|---|
| Allen Orlando Carruth Living Trust | -- | None Listed On Document | |
| Carruth Allen O | -- | Lsi Title Company | |
| Carruth Allen O | -- | -- |
Source: Public Records
Mortgage History
| Date | Status | Borrower | Loan Amount |
|---|---|---|---|
| Previous Owner | Carruth Allen O | $140,600 | |
| Previous Owner | Carruth Allen O | $25,000 |
Source: Public Records
Tax History Compared to Growth
Tax History
| Year | Tax Paid | Tax Assessment Tax Assessment Total Assessment is a certain percentage of the fair market value that is determined by local assessors to be the total taxable value of land and additions on the property. | Land | Improvement |
|---|---|---|---|---|
| 2025 | $2,061 | $159,928 | $60,660 | $99,268 |
| 2024 | $2,061 | $146,989 | $59,471 | $87,518 |
| 2023 | $2,035 | $144,107 | $58,305 | $85,802 |
| 2022 | $1,925 | $141,282 | $57,162 | $84,120 |
| 2021 | $1,921 | $138,513 | $56,042 | $82,471 |
| 2020 | $1,883 | $137,094 | $55,468 | $81,626 |
| 2019 | $1,873 | $134,407 | $54,381 | $80,026 |
| 2018 | $1,741 | $131,772 | $53,315 | $78,457 |
| 2017 | $2,053 | $129,189 | $52,270 | $76,919 |
| 2016 | $1,704 | $126,657 | $51,246 | $75,411 |
| 2015 | $1,578 | $124,756 | $50,477 | $74,279 |
| 2014 | $1,597 | $122,313 | $49,489 | $72,824 |
Source: Public Records
Map
Nearby Homes
- 4323 Oconner Way
- 173 Bell Ave
- 2 Keely Ct
- 230 Du Bois Ave
- 335 Jessie Ave
- 328 Las Animas Cir
- 1 Butterwick Ct
- Plan 7 at Valley Vista
- Plan 3 at Valley Vista
- Plan 7 at Valley Vista
- Plan 8 at Valley Vista
- Plan 8 at Valley Vista
- Plan 3 at Valley Vista
- Plan 1 at Valley Vista
- Plan 1 at Valley Vista
- Plan 3A at Valley Vista
- Plan 3A at Valley Vista
- 21 Oak Manor Way Unit Lot78
- 400 Berthoud St
- 204 Arbor Crest Way