Estimated Value: $127,000 - $183,000
3
Beds
1
Bath
1,165
Sq Ft
$124/Sq Ft
Est. Value
About This Home
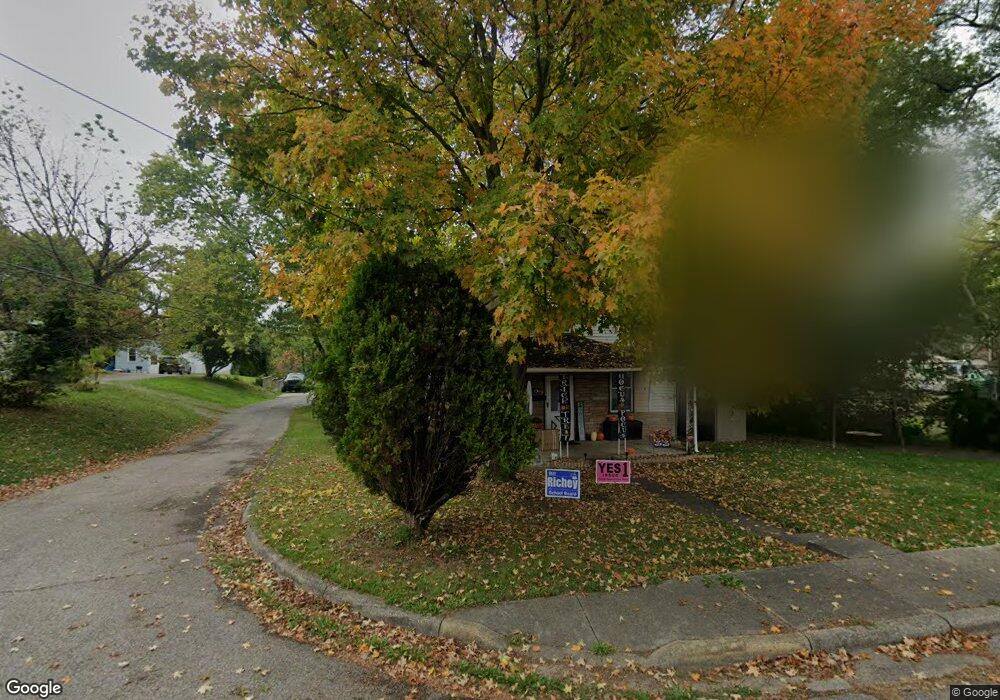
This home is located at 136 Fayette St, Xenia, OH 45385 and is currently estimated at $144,483, approximately $124 per square foot. 136 Fayette St is a home located in Greene County with nearby schools including Xenia High School, Summit Academy Community School for Alternative Learners - Xenia, and Legacy Christian Academy.
Ownership History
Date
Name
Owned For
Owner Type
Purchase Details
Closed on
Sep 11, 2014
Sold by
Advantalra Trust Llc
Bought by
Hughes Angela M
Current Estimated Value
Home Financials for this Owner
Home Financials are based on the most recent Mortgage that was taken out on this home.
Original Mortgage
$54,494
Outstanding Balance
$41,734
Interest Rate
4.15%
Mortgage Type
FHA
Estimated Equity
$102,749
Purchase Details
Closed on
Aug 14, 2013
Sold by
Connolly Collene M
Bought by
Advantaira Trust Llc
Purchase Details
Closed on
Jun 27, 1994
Sold by
Snyder Frederick E
Bought by
Bartle Susan B and Bartle Connolly M
Home Financials for this Owner
Home Financials are based on the most recent Mortgage that was taken out on this home.
Original Mortgage
$45,347
Interest Rate
8.78%
Mortgage Type
FHA
Create a Home Valuation Report for This Property
The Home Valuation Report is an in-depth analysis detailing your home's value as well as a comparison with similar homes in the area
Home Values in the Area
Average Home Value in this Area
Purchase History
| Date | Buyer | Sale Price | Title Company |
|---|---|---|---|
| Hughes Angela M | $55,500 | None Available | |
| Advantaira Trust Llc | $15,500 | None Available | |
| Bartle Susan B | $44,900 | -- |
Source: Public Records
Mortgage History
| Date | Status | Borrower | Loan Amount |
|---|---|---|---|
| Open | Hughes Angela M | $54,494 | |
| Previous Owner | Bartle Susan B | $45,347 |
Source: Public Records
Tax History Compared to Growth
Tax History
| Year | Tax Paid | Tax Assessment Tax Assessment Total Assessment is a certain percentage of the fair market value that is determined by local assessors to be the total taxable value of land and additions on the property. | Land | Improvement |
|---|---|---|---|---|
| 2024 | $1,288 | $30,090 | $4,860 | $25,230 |
| 2023 | $1,288 | $30,090 | $4,860 | $25,230 |
| 2022 | $1,133 | $22,580 | $3,890 | $18,690 |
| 2021 | $1,148 | $22,580 | $3,890 | $18,690 |
| 2020 | $1,100 | $22,580 | $3,890 | $18,690 |
| 2019 | $1,174 | $22,680 | $4,330 | $18,350 |
| 2018 | $1,178 | $22,680 | $4,330 | $18,350 |
| 2017 | $1,126 | $22,680 | $4,330 | $18,350 |
| 2016 | $1,127 | $21,280 | $4,330 | $16,950 |
| 2015 | $1,130 | $21,280 | $4,330 | $16,950 |
| 2014 | $1,226 | $21,280 | $4,330 | $16,950 |
Source: Public Records
Map
Nearby Homes