Estimated Value: $202,000 - $212,000
3
Beds
2
Baths
1,457
Sq Ft
$141/Sq Ft
Est. Value
About This Home
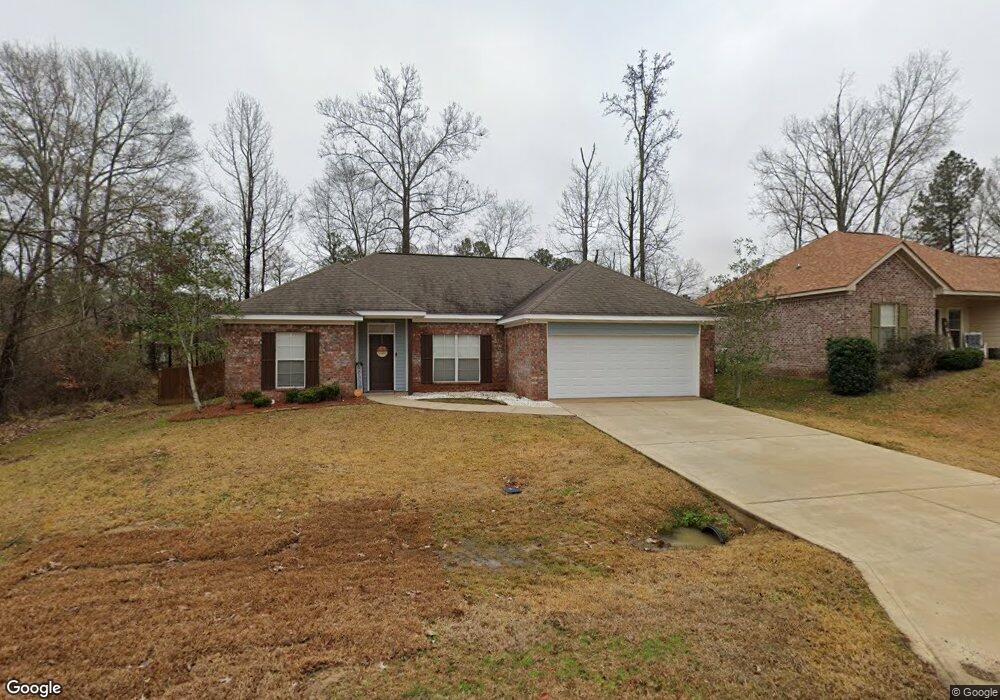
This home is located at 136 Gaddy Dr Unit 9, Byram, MS 39272 and is currently estimated at $206,035, approximately $141 per square foot. 136 Gaddy Dr Unit 9 is a home located in Hinds County with nearby schools including Gary Road Elementary School, Gary Road Intermediate School, and Byram Middle School.
Ownership History
Date
Name
Owned For
Owner Type
Purchase Details
Closed on
Jan 28, 2019
Sold by
Boone Sarah R
Bought by
Austin Travoris D
Current Estimated Value
Home Financials for this Owner
Home Financials are based on the most recent Mortgage that was taken out on this home.
Original Mortgage
$139,000
Outstanding Balance
$122,206
Interest Rate
4.5%
Mortgage Type
New Conventional
Estimated Equity
$83,829
Purchase Details
Closed on
Apr 27, 2018
Sold by
Boone Matthew L and Boone Sarah R
Bought by
Boone Sarah R
Home Financials for this Owner
Home Financials are based on the most recent Mortgage that was taken out on this home.
Original Mortgage
$130,000
Interest Rate
4.44%
Mortgage Type
New Conventional
Purchase Details
Closed on
Nov 7, 2014
Sold by
J And N Builders Inc
Bought by
Boone Mathew Lawrence and Ricks Sarah
Home Financials for this Owner
Home Financials are based on the most recent Mortgage that was taken out on this home.
Original Mortgage
$131,650
Interest Rate
4.16%
Mortgage Type
New Conventional
Create a Home Valuation Report for This Property
The Home Valuation Report is an in-depth analysis detailing your home's value as well as a comparison with similar homes in the area
Home Values in the Area
Average Home Value in this Area
Purchase History
| Date | Buyer | Sale Price | Title Company |
|---|---|---|---|
| Austin Travoris D | -- | -- | |
| Boone Sarah R | -- | -- | |
| Boone Mathew Lawrence | -- | None Available |
Source: Public Records
Mortgage History
| Date | Status | Borrower | Loan Amount |
|---|---|---|---|
| Open | Austin Travoris D | $139,000 | |
| Previous Owner | Boone Sarah R | $130,000 | |
| Previous Owner | Boone Mathew Lawrence | $131,650 |
Source: Public Records
Tax History
| Year | Tax Paid | Tax Assessment Tax Assessment Total Assessment is a certain percentage of the fair market value that is determined by local assessors to be the total taxable value of land and additions on the property. | Land | Improvement |
|---|---|---|---|---|
| 2025 | $1,540 | $12,026 | $2,500 | $9,526 |
| 2024 | $1,540 | $11,764 | $2,500 | $9,264 |
| 2023 | $1,540 | $11,764 | $2,500 | $9,264 |
| 2022 | $1,810 | $11,764 | $2,500 | $9,264 |
| 2021 | $1,486 | $11,764 | $2,500 | $9,264 |
| 2020 | $1,456 | $11,721 | $2,500 | $9,221 |
| 2019 | $1,448 | $11,721 | $2,500 | $9,221 |
| 2018 | $1,448 | $11,721 | $2,500 | $9,221 |
| 2017 | $2,273 | $11,721 | $2,500 | $9,221 |
| 2016 | $2,273 | $17,582 | $3,750 | $13,832 |
| 2015 | $2,242 | $17,367 | $3,750 | $13,617 |
| 2014 | $271 | $1,875 | $1,875 | $0 |
Source: Public Records
Map
Nearby Homes
- 458 Lee St
- 5114 Brookleigh Dr
- 3211 Ryan Cove
- 156 Blackmon Rd
- 150 Foxwood Cove
- 236 Par Cove
- 3118 Tynes Dr
- 273 W Lake Dockery Dr
- 111 Blackmon Rd
- 00000 Forest Hill Rd
- 5230 Brookleigh Dr
- 5428 Terry Rd
- 5039 Forest Hill Rd
- 5552 Terry Rd
- 5252 Skylark Dr
- 73 Dianne Cove
- 1056 Lake Dockery Rd
- 737 Forest Woods Dr Unit 48
- 316 Southhaven Dr
- 5247 Canary Dr
- 136 Gaddy Dr
- 132 Gaddy Dr Unit 8
- 132 Gaddy Dr
- 132 Torrence Cove
- 144 Gaddy Dr Unit 11
- 140 Gaddy Dr Unit 10
- 140 Gaddy Dr
- 144 Gaddy Dr
- 136 Torrence Cove
- 128 Torrence Cove
- 199 Gaddy Dr Unit 54
- 195 Gaddy Dr Unit 53
- 167 Gaddy Dr Unit 84
- 155 Gaddy Dr Unit 72
- 195 Gaddy Dr
- 199 Gaddy Dr
- 155 Gaddy Dr
- 167 Gaddy Dr
- 165 Gaddy Dr
- 128 Gaddy Dr
Your Personal Tour Guide
Ask me questions while you tour the home.