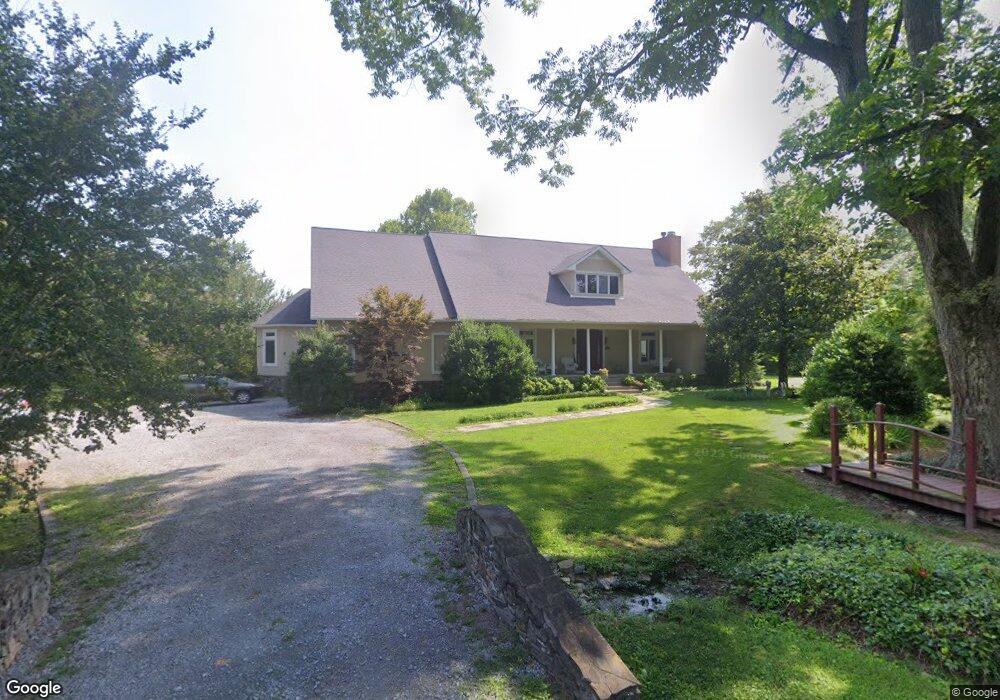
136 Gibbs Landing Carthage, TN 37030
Estimated Value: $720,490 - $1,036,000
5
Beds
6
Baths
3,988
Sq Ft
$209/Sq Ft
Est. Value
About This Home
This home is located at 136 Gibbs Landing, Carthage, TN 37030 and is currently estimated at $834,497, approximately $209 per square foot. 136 Gibbs Landing is a home located in Smith County with nearby schools including Carthage Elementary School, Smith County Middle School, and Smith County High School.
Ownership History
Date
Name
Owned For
Owner Type
Purchase Details
Closed on
Dec 28, 2018
Sold by
Strickland Thomas M
Bought by
Woodard Jerry and Woodard Shirley
Current Estimated Value
Home Financials for this Owner
Home Financials are based on the most recent Mortgage that was taken out on this home.
Original Mortgage
$225,600
Outstanding Balance
$199,145
Interest Rate
4.8%
Mortgage Type
New Conventional
Estimated Equity
$635,352
Purchase Details
Closed on
Jun 2, 2006
Sold by
Sherry Fisher
Bought by
Strickland Thomas M
Home Financials for this Owner
Home Financials are based on the most recent Mortgage that was taken out on this home.
Original Mortgage
$335,000
Interest Rate
6.5%
Purchase Details
Closed on
Aug 31, 1993
Bought by
Cummings Sherry Fisher
Purchase Details
Closed on
Feb 11, 1977
Bought by
Eatherly Patrick H
Create a Home Valuation Report for This Property
The Home Valuation Report is an in-depth analysis detailing your home's value as well as a comparison with similar homes in the area
Home Values in the Area
Average Home Value in this Area
Purchase History
| Date | Buyer | Sale Price | Title Company |
|---|---|---|---|
| Woodard Jerry | $282,000 | None Available | |
| Strickland Thomas M | $459,000 | -- | |
| Cummings Sherry Fisher | $30,000 | -- | |
| Eatherly Patrick H | -- | -- |
Source: Public Records
Mortgage History
| Date | Status | Borrower | Loan Amount |
|---|---|---|---|
| Open | Woodard Jerry | $225,600 | |
| Previous Owner | Eatherly Patrick H | $335,000 |
Source: Public Records
Tax History Compared to Growth
Tax History
| Year | Tax Paid | Tax Assessment Tax Assessment Total Assessment is a certain percentage of the fair market value that is determined by local assessors to be the total taxable value of land and additions on the property. | Land | Improvement |
|---|---|---|---|---|
| 2024 | $2,481 | $143,150 | $10,100 | $133,050 |
| 2023 | $2,481 | $143,150 | $0 | $0 |
| 2022 | $3,492 | $143,150 | $10,100 | $133,050 |
| 2021 | $3,144 | $91,125 | $10,100 | $81,025 |
| 2020 | $3,372 | $91,125 | $10,100 | $81,025 |
| 2019 | $3,372 | $91,125 | $10,100 | $81,025 |
| 2018 | $3,545 | $113,950 | $10,100 | $103,850 |
| 2017 | $3,545 | $113,950 | $10,100 | $103,850 |
| 2016 | $3,248 | $98,725 | $7,575 | $91,150 |
| 2015 | $3,248 | $98,725 | $7,575 | $91,150 |
| 2014 | $3,248 | $98,725 | $7,575 | $91,150 |
Source: Public Records
Map
Nearby Homes
- 194 Hunter Ave
- 0 Bowman St
- 139 Davis St S
- 228 Hillcrest Dr N
- 0 High St N Unit RTC3000420
- 6 Bradford Hill Rd
- 604 College Ave E
- 0 Sanders Dr
- 218 Ward Ave E
- 407 College Ave E
- 217 Fite Ave E
- 305 Myers Terrace
- 307 College Ave E
- 319 Hull Ave
- 733 Jackson Ave
- 204 Fisher Ave
- 0 Main St N
- 225 Jackson Ave
- 659 Ridgeway Dr
- 704 Main St N
- 136 Gibbs Landing Dr
- 131 Gibbs Landing Dr
- 106 Gibbs Landing Dr
- 106 Gibbs Landing Dr
- 120 Gibbs Landing Dr
- 2A Gibbs Landing
- 1B Gibbs Landing
- 1 B Gibbs Landing
- 2 A Gibbs Landing
- 121 Gibbs Landing Dr
- 119 Gibbs Landing Dr
- 119 Gibbs Landing Dr
- 104 Gibbs Landing Dr
- 117 Gibbs Landing Dr
- 102 Gibbs Landing Dr
- 147 Cookeville Hwy
- 153 Cookeville Hwy
- 133 Cookeville Hwy
- 129 Cookeville Hwy
- 134 Cookeville Hwy