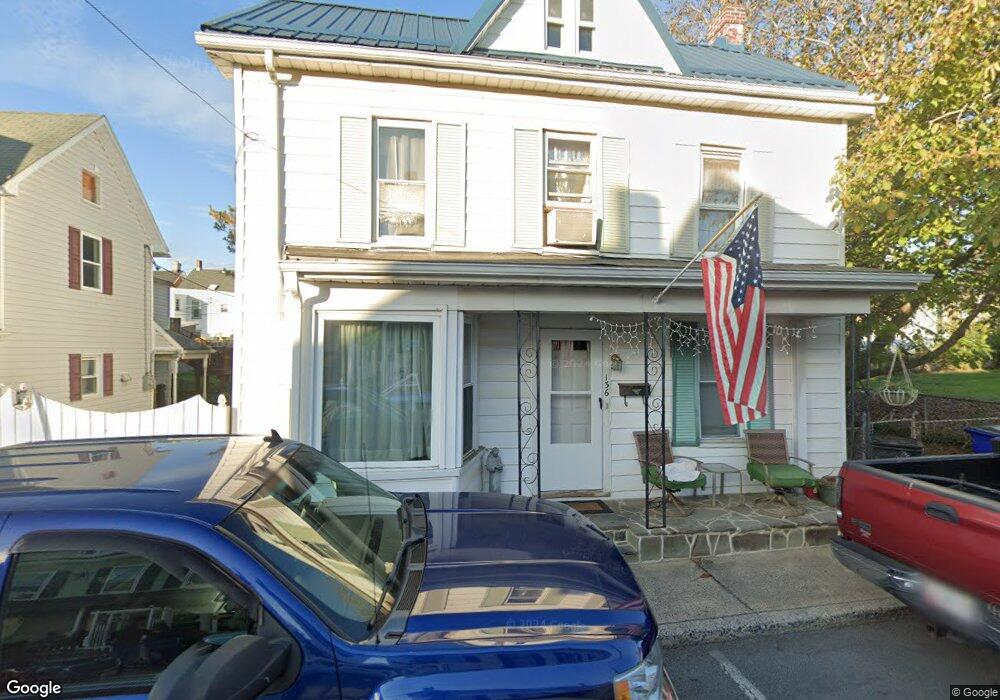
136 John St Hagerstown, MD 21740
Central NeighborhoodEstimated Value: $168,065 - $230,000
--
Bed
1
Bath
1,637
Sq Ft
$122/Sq Ft
Est. Value
About This Home
This home is located at 136 John St, Hagerstown, MD 21740 and is currently estimated at $200,266, approximately $122 per square foot. 136 John St is a home located in Washington County with nearby schools including Ruth Ann Monroe Primary School, Eastern Elementary School, and Otsego West Campus High School.
Ownership History
Date
Name
Owned For
Owner Type
Purchase Details
Closed on
Nov 9, 2021
Sold by
Clippinger Roger L and Clippinger Aida R
Bought by
Dmj Llc
Current Estimated Value
Purchase Details
Closed on
Apr 12, 1991
Sold by
Rohrer Lona L
Bought by
Clippinger Roger L and Clippinger Aida R
Home Financials for this Owner
Home Financials are based on the most recent Mortgage that was taken out on this home.
Original Mortgage
$62,650
Interest Rate
9.48%
Create a Home Valuation Report for This Property
The Home Valuation Report is an in-depth analysis detailing your home's value as well as a comparison with similar homes in the area
Home Values in the Area
Average Home Value in this Area
Purchase History
| Date | Buyer | Sale Price | Title Company |
|---|---|---|---|
| Dmj Llc | $80,000 | Premier Stlmts & Ttl Svcs Ll | |
| Clippinger Roger L | $61,500 | -- |
Source: Public Records
Mortgage History
| Date | Status | Borrower | Loan Amount |
|---|---|---|---|
| Previous Owner | Clippinger Roger L | $62,650 |
Source: Public Records
Tax History Compared to Growth
Tax History
| Year | Tax Paid | Tax Assessment Tax Assessment Total Assessment is a certain percentage of the fair market value that is determined by local assessors to be the total taxable value of land and additions on the property. | Land | Improvement |
|---|---|---|---|---|
| 2025 | $1,385 | $174,100 | $20,000 | $154,100 |
| 2024 | $1,385 | $152,067 | $0 | $0 |
| 2023 | $1,185 | $130,033 | $0 | $0 |
| 2022 | $984 | $108,000 | $20,000 | $88,000 |
| 2021 | $2,035 | $101,800 | $0 | $0 |
| 2020 | $836 | $95,600 | $0 | $0 |
| 2019 | $836 | $89,400 | $20,000 | $69,400 |
| 2018 | $1,084 | $89,400 | $20,000 | $69,400 |
| 2017 | $865 | $89,400 | $0 | $0 |
| 2016 | -- | $92,500 | $0 | $0 |
| 2015 | -- | $92,500 | $0 | $0 |
| 2014 | $1,719 | $92,500 | $0 | $0 |
Source: Public Records
Map
Nearby Homes
- 409 N Mulberry St
- 409 411 N Mulberry St
- 308 N Locust St
- 133 Randolph Ave
- 133 Broadway
- 54 Randolph Ave
- 243 N Locust St
- 39 E North Ave
- 227 N Locust St
- 207 N Mulberry St
- 142 East Ave
- 115 East Ave
- 545 N Mulberry St
- 136 N Cannon Ave
- 338 Liberty St
- 200 E Franklin St
- 312 E Franklin St
- 351 Liberty St
- 41 Fairground Ave
- 39 Charles St