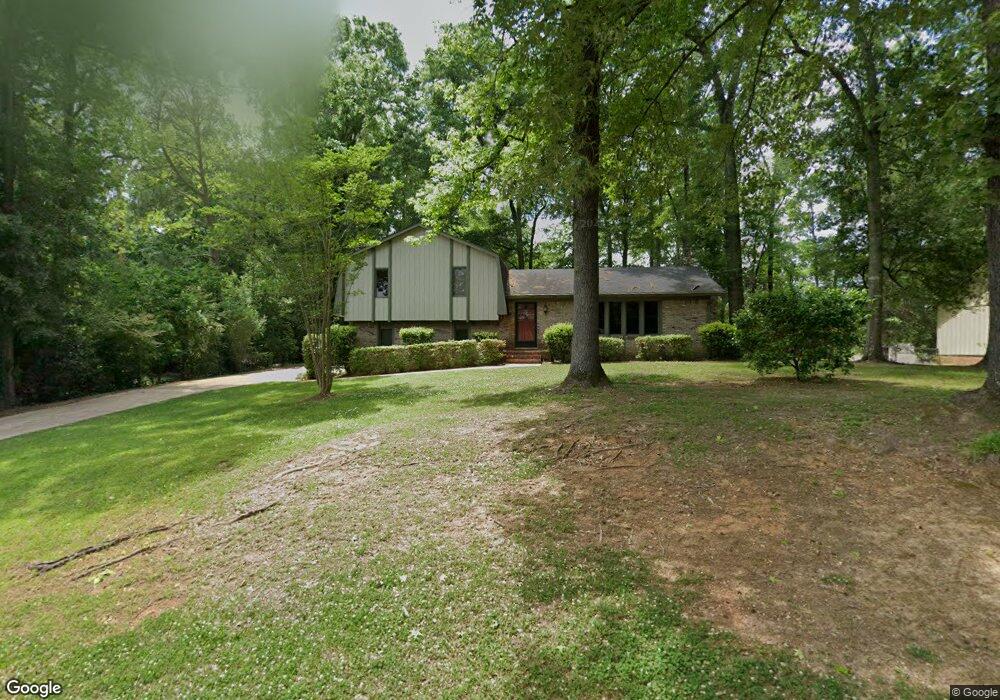
136 Maple St Maylene, AL 35114
Estimated Value: $248,000 - $285,922
3
Beds
2
Baths
1,863
Sq Ft
$144/Sq Ft
Est. Value
About This Home
This home is located at 136 Maple St, Maylene, AL 35114 and is currently estimated at $267,481, approximately $143 per square foot. 136 Maple St is a home located in Shelby County with nearby schools including Thompson Intermediate School, Thompson Middle School, and Thompson High School.
Ownership History
Date
Name
Owned For
Owner Type
Purchase Details
Closed on
Mar 5, 2010
Sold by
Holden Peter and Holden Libbi Langford
Bought by
Duncan Daniel
Current Estimated Value
Home Financials for this Owner
Home Financials are based on the most recent Mortgage that was taken out on this home.
Original Mortgage
$109,600
Interest Rate
5.01%
Mortgage Type
New Conventional
Purchase Details
Closed on
Feb 25, 2005
Sold by
Cover Jesse M
Bought by
Holden Peter
Home Financials for this Owner
Home Financials are based on the most recent Mortgage that was taken out on this home.
Original Mortgage
$128,800
Interest Rate
5.68%
Mortgage Type
Unknown
Purchase Details
Closed on
Jul 31, 2000
Sold by
Thomas Maas Michael and Turner Billie
Bought by
Cover Jesse M
Home Financials for this Owner
Home Financials are based on the most recent Mortgage that was taken out on this home.
Original Mortgage
$104,350
Interest Rate
8.12%
Create a Home Valuation Report for This Property
The Home Valuation Report is an in-depth analysis detailing your home's value as well as a comparison with similar homes in the area
Home Values in the Area
Average Home Value in this Area
Purchase History
| Date | Buyer | Sale Price | Title Company |
|---|---|---|---|
| Duncan Daniel | -- | None Available | |
| Holden Peter | $128,800 | -- | |
| Cover Jesse M | $105,000 | -- |
Source: Public Records
Mortgage History
| Date | Status | Borrower | Loan Amount |
|---|---|---|---|
| Closed | Duncan Daniel | $109,600 | |
| Previous Owner | Holden Peter | $128,800 | |
| Previous Owner | Cover Jesse M | $104,350 |
Source: Public Records
Tax History
| Year | Tax Paid | Tax Assessment Tax Assessment Total Assessment is a certain percentage of the fair market value that is determined by local assessors to be the total taxable value of land and additions on the property. | Land | Improvement |
|---|---|---|---|---|
| 2024 | $1,274 | $23,600 | $0 | $0 |
| 2023 | $1,144 | $21,940 | $0 | $0 |
| 2022 | $1,060 | $20,380 | $0 | $0 |
| 2021 | $945 | $18,260 | $0 | $0 |
| 2020 | $879 | $0 | $0 | $0 |
| 2019 | $825 | $16,040 | $0 | $0 |
| 2017 | $701 | $13,740 | $0 | $0 |
| 2015 | $680 | $13,360 | $0 | $0 |
| 2014 | $663 | $13,040 | $0 | $0 |
Source: Public Records
Map
Nearby Homes
- 1315 Yellowleaf Cir
- 125 Mountain Pkwy
- 257 Lacey Ave
- 166 Cedar Grove Pkwy
- 221 Lacey Ave
- 217 Kensington Ln
- 549 Ramsgate Dr
- 545 Ramsgate Dr
- 544 Ramsgate Dr
- 305 Cedar Grove Ct
- 236 Queens Gate
- 309 Cedar Grove Ct
- 312 Cornwall Dr
- 120 Sterling Gate Dr
- 501 Ramsgate Dr
- 208 Queens Gate
- 537 Ramsgate Dr
- 316 Sterling Manor Cir
- 117 Kensington Ln
- 280 Cedar Grove Pkwy
Your Personal Tour Guide
Ask me questions while you tour the home.