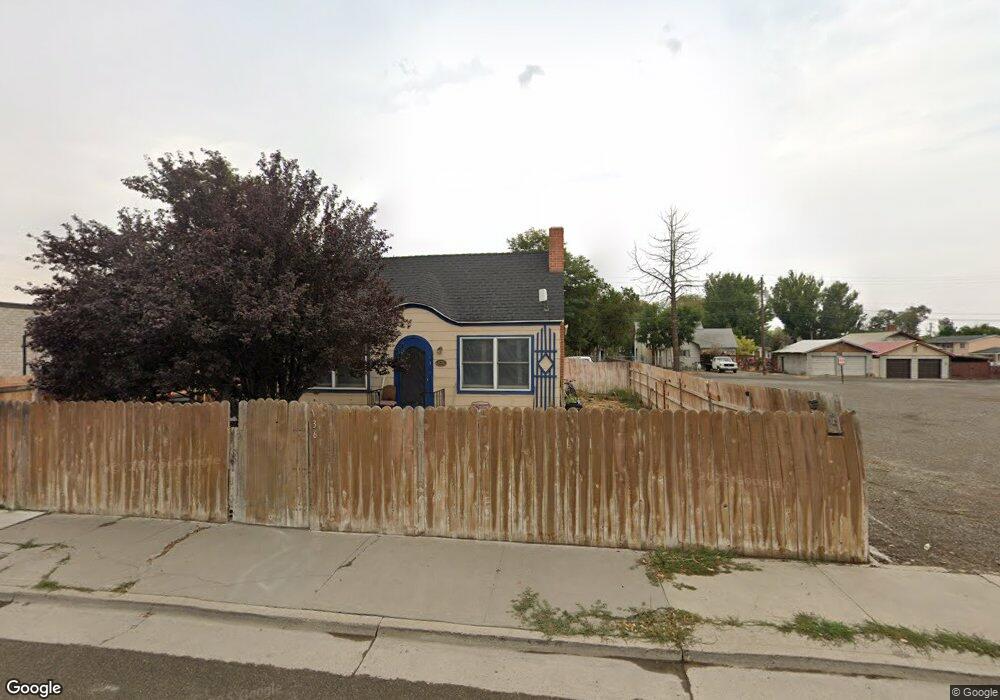
136 Melarkey St Winnemucca, NV 89445
Estimated Value: $233,339 - $293,000
3
Beds
2
Baths
962
Sq Ft
$279/Sq Ft
Est. Value
About This Home
This home is located at 136 Melarkey St, Winnemucca, NV 89445 and is currently estimated at $268,835, approximately $279 per square foot. 136 Melarkey St is a home located in Humboldt County with nearby schools including Sonoma Heights Elementary School, Winnemucca Junior High School, and French Ford Middle School.
Ownership History
Date
Name
Owned For
Owner Type
Purchase Details
Closed on
Jun 7, 2021
Sold by
Steve And Honorine Patterson Family Trus
Bought by
Kohl Sara L and Adams Linda F
Current Estimated Value
Purchase Details
Closed on
Jan 7, 2021
Sold by
Patterson Steven R and Patterson Honorine
Bought by
Kohl Sara L and Adams Linda F
Home Financials for this Owner
Home Financials are based on the most recent Mortgage that was taken out on this home.
Original Mortgage
$176,739
Interest Rate
2.98%
Mortgage Type
FHA
Purchase Details
Closed on
Nov 30, 2010
Sold by
Aboud Michael J
Bought by
Patterson Steven R and Patterson Honorine
Create a Home Valuation Report for This Property
The Home Valuation Report is an in-depth analysis detailing your home's value as well as a comparison with similar homes in the area
Home Values in the Area
Average Home Value in this Area
Purchase History
| Date | Buyer | Sale Price | Title Company |
|---|---|---|---|
| Kohl Sara L | $180,000 | Stewart Title | |
| Kohl Sara L | $180,000 | Stewart Title Company | |
| Patterson Steven R | $115,000 | Western Title Company Llc | |
| Aboud Michael J | $115,000 | Western Title Company Llc |
Source: Public Records
Mortgage History
| Date | Status | Borrower | Loan Amount |
|---|---|---|---|
| Previous Owner | Kohl Sara L | $176,739 |
Source: Public Records
Tax History Compared to Growth
Tax History
| Year | Tax Paid | Tax Assessment Tax Assessment Total Assessment is a certain percentage of the fair market value that is determined by local assessors to be the total taxable value of land and additions on the property. | Land | Improvement |
|---|---|---|---|---|
| 2025 | $907 | $24,920 | $8,050 | $16,870 |
| 2024 | $863 | $24,645 | $8,050 | $16,594 |
| 2023 | $863 | $23,275 | $8,050 | $15,225 |
| 2022 | $755 | $20,761 | $8,050 | $12,711 |
| 2021 | $707 | $20,418 | $8,050 | $12,368 |
| 2020 | $681 | $18,493 | $6,125 | $12,368 |
| 2019 | $661 | $17,818 | $6,125 | $11,693 |
| 2018 | $635 | $16,626 | $6,125 | $10,501 |
| 2017 | $629 | $16,428 | $6,125 | $10,303 |
| 2016 | $631 | $16,366 | $6,125 | $10,241 |
| 2015 | $541 | $16,078 | $6,125 | $9,953 |
| 2014 | $541 | $15,724 | $6,125 | $9,599 |
Source: Public Records
Map
Nearby Homes