136 Merry Mont Rd Littleton, NH 03561
Estimated Value: $313,000 - $397,038
4
Beds
3
Baths
1,309
Sq Ft
$273/Sq Ft
Est. Value
About This Home
This home is located at 136 Merry Mont Rd, Littleton, NH 03561 and is currently estimated at $356,760, approximately $272 per square foot. 136 Merry Mont Rd is a home with nearby schools including Mildred C. Lakeway School, North Country Charter Academy (M), and North Country Charter Academy.
Ownership History
Date
Name
Owned For
Owner Type
Purchase Details
Closed on
Jan 8, 2024
Sold by
Carol A Ilacqua Ret and Ilacqua
Bought by
Ilaqua Anthony J
Current Estimated Value
Purchase Details
Closed on
Jan 16, 1993
Bought by
Ilacqua Anthony F and Ilacqua Carol A
Create a Home Valuation Report for This Property
The Home Valuation Report is an in-depth analysis detailing your home's value as well as a comparison with similar homes in the area
Home Values in the Area
Average Home Value in this Area
Purchase History
| Date | Buyer | Sale Price | Title Company |
|---|---|---|---|
| Ilaqua Anthony J | -- | None Available | |
| Ilaqua Anthony J | -- | None Available | |
| Ilacqua Joseph J | -- | None Available | |
| Ilacqua Anthony J | -- | None Available | |
| Ilacqua Anthony F | -- | -- |
Source: Public Records
Tax History Compared to Growth
Tax History
| Year | Tax Paid | Tax Assessment Tax Assessment Total Assessment is a certain percentage of the fair market value that is determined by local assessors to be the total taxable value of land and additions on the property. | Land | Improvement |
|---|---|---|---|---|
| 2024 | $4,373 | $175,340 | $31,740 | $143,600 |
| 2023 | $7,227 | $320,640 | $31,740 | $288,900 |
| 2022 | $7,771 | $336,990 | $48,090 | $288,900 |
| 2021 | $7,783 | $337,490 | $48,590 | $288,900 |
| 2020 | $7,308 | $337,530 | $48,630 | $288,900 |
| 2019 | $5,728 | $298,130 | $38,830 | $259,300 |
| 2018 | $5,605 | $298,000 | $38,700 | $259,300 |
| 2017 | $7,321 | $283,550 | $37,950 | $245,600 |
| 2016 | $5,305 | $282,190 | $38,290 | $243,900 |
| 2015 | $7,628 | $327,100 | $65,600 | $261,500 |
| 2014 | $7,262 | $327,100 | $65,600 | $261,500 |
| 2013 | $7,356 | $327,500 | $66,000 | $261,500 |
Source: Public Records
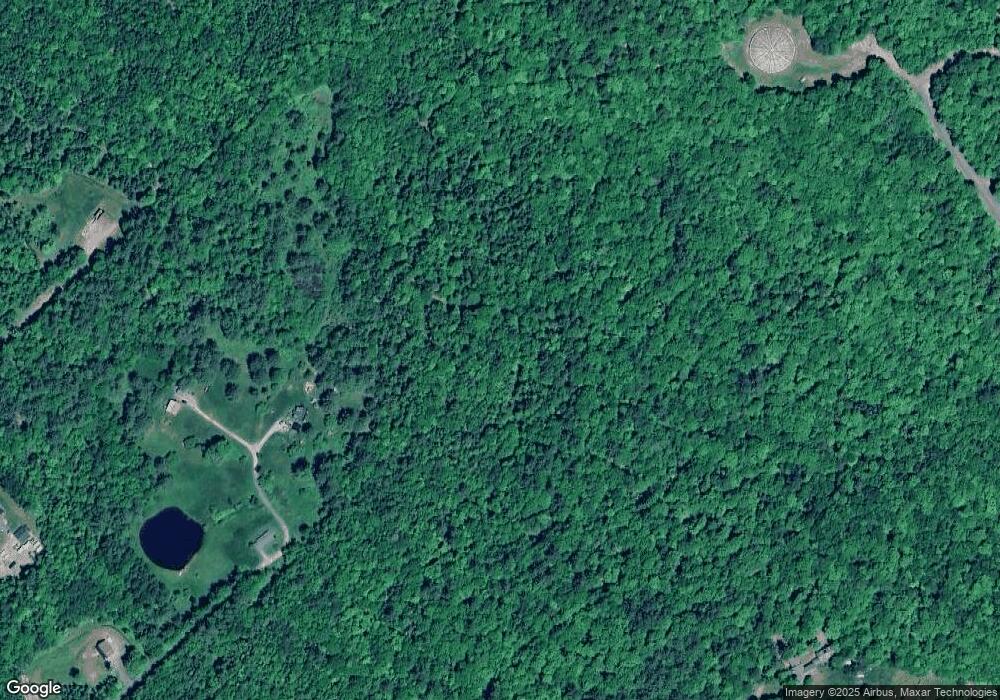
Map
Nearby Homes
- 92-29 Birchcroft Dr
- 166 Riverside Dr
- 60-70 Meadow St
- 134 Cottage St
- 194 Main St
- 000 Dells Rd Unit 1
- 165 Bethlehem Rd
- 33 Pleasant St
- 36 MacIver Rd
- 34 Union St
- 251 Bethlehem Rd
- 93 Pleasant St
- 114 Highland Ave
- 180 Beacon St
- 45 Point of View Dr
- 11 Richmond St
- 191 Washington St
- 14 Hilltop Manor Mobile Home Park
- 99 Girard Rd
- 456 Brickyard Rd
- 135 Merry Mont Rd
- 137 Merry Mont Rd
- 201 Pilgrim Dr
- 133 Merry Mont Rd
- 182 Pilgrim Dr
- 0 Merry Mont Rd
- 165 Pilgrim Dr
- 128 Pilgrim Dr
- 338 Mount Eustis Rd
- 129 Pilgrim Dr
- 10 Merry Mont Rd
- 772 Mount Eustis Rd
- 672 Mount Eustis Rd
- 708 Mount Eustis Rd
- 34 Pilgrim Dr
- 65 Pilgrim Dr
- 793 Mount Eustis Rd
- 640 Mount Eustis Rd
- 582 Mount Eustis Rd
- 614 Mount Eustis Rd