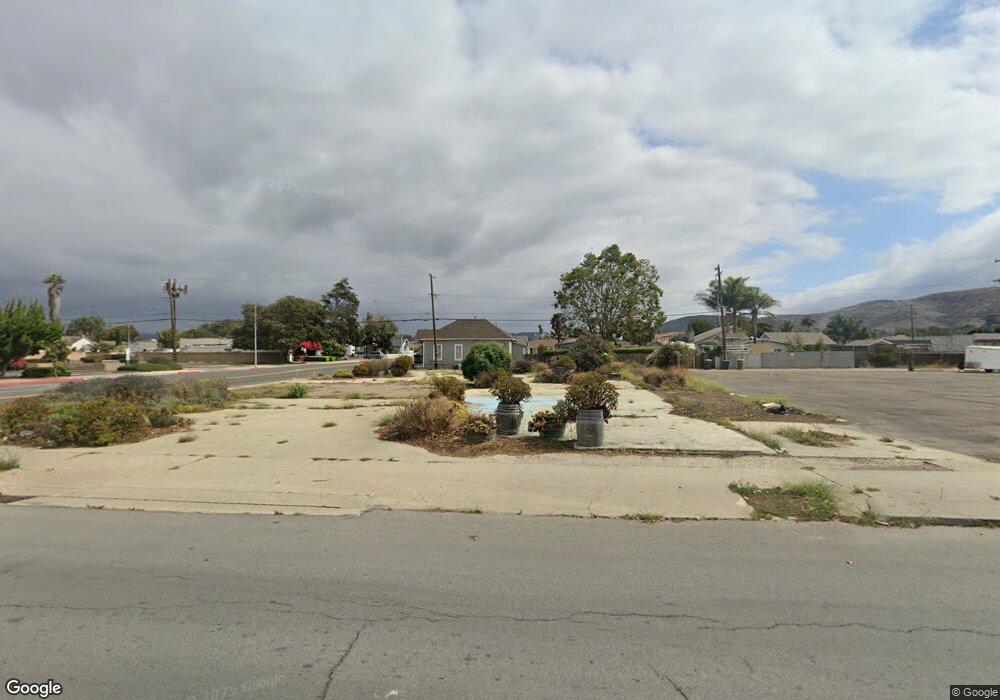
136 N H St Lompoc, CA 93436
Studio
--
Bath
--
Sq Ft
13,939
Sq Ft Lot
About This Home
This home is located at 136 N H St, Lompoc, CA 93436. 136 N H St is a home located in Santa Barbara County with nearby schools including Arthur Hapgood Elementary School, Lompoc Valley Middle School, and Lompoc High School.
Ownership History
Date
Name
Owned For
Owner Type
Purchase Details
Closed on
May 24, 2021
Sold by
Cox Lorraine M and Cox Terrill F
Bought by
Lompoc Theatre Project Corporation
Purchase Details
Closed on
Mar 30, 2017
Sold by
Cox Lorraine M
Bought by
Cox Lorraine M
Purchase Details
Closed on
Oct 25, 2011
Sold by
Lompoc Housing & Community Development G
Bought by
Fox Terrill F and Fox Lorraine M
Purchase Details
Closed on
Aug 6, 2007
Sold by
Cox Terrill F and Cox Lorraine M
Bought by
Lompoc Housing & Cmnty Development Corp
Home Financials for this Owner
Home Financials are based on the most recent Mortgage that was taken out on this home.
Original Mortgage
$650,000
Interest Rate
6.65%
Mortgage Type
Seller Take Back
Purchase Details
Closed on
Mar 31, 1998
Sold by
Cox Terrill F and Cox Lorraine M
Bought by
Cox Terrill F and Cox Lorraine M
Create a Home Valuation Report for This Property
The Home Valuation Report is an in-depth analysis detailing your home's value as well as a comparison with similar homes in the area
Home Values in the Area
Average Home Value in this Area
Purchase History
| Date | Buyer | Sale Price | Title Company |
|---|---|---|---|
| Lompoc Theatre Project Corporation | -- | None Available | |
| Cox Lorraine M | -- | None Available | |
| Fox Terrill F | -- | First American Title Company | |
| Lompoc Housing & Cmnty Development Corp | $750,000 | Chicago Title | |
| Cox Terrill F | -- | -- | |
| Cox Terrill F | -- | -- |
Source: Public Records
Mortgage History
| Date | Status | Borrower | Loan Amount |
|---|---|---|---|
| Previous Owner | Lompoc Housing & Cmnty Development Corp | $650,000 |
Source: Public Records
Tax History
| Year | Tax Paid | Tax Assessment Tax Assessment Total Assessment is a certain percentage of the fair market value that is determined by local assessors to be the total taxable value of land and additions on the property. | Land | Improvement |
|---|---|---|---|---|
| 2025 | $2,042 | $188,341 | $188,341 | -- |
| 2023 | $2,042 | $181,029 | $181,029 | $0 |
| 2022 | $2,008 | $177,480 | $177,480 | $0 |
| 2021 | $2,031 | $174,000 | $174,000 | $0 |
| 2020 | $1,996 | $171,000 | $171,000 | $0 |
| 2019 | $1,967 | $168,000 | $168,000 | $0 |
| 2018 | $1,940 | $165,000 | $165,000 | $0 |
| 2017 | $2,365 | $201,000 | $201,000 | $0 |
| 2016 | $2,251 | $191,000 | $191,000 | $0 |
| 2014 | $2,175 | $182,000 | $182,000 | $0 |
Source: Public Records
Map
Nearby Homes
Your Personal Tour Guide
Ask me questions while you tour the home.