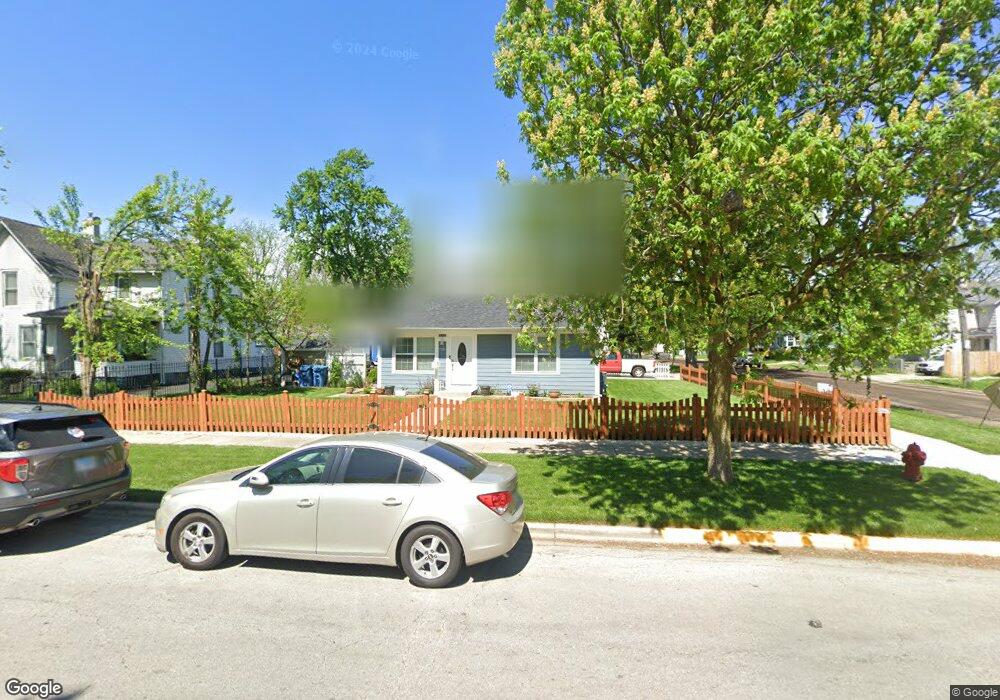
136 N Root St Aurora, IL 60505
McCarty Burlington NeighborhoodEstimated Value: $211,000 - $271,000
3
Beds
1
Bath
1,080
Sq Ft
$219/Sq Ft
Est. Value
About This Home
This home is located at 136 N Root St, Aurora, IL 60505 and is currently estimated at $236,957, approximately $219 per square foot. 136 N Root St is a home located in Kane County with nearby schools including Brady Elementary School, Simmons Middle School, and East Aurora High School.
Ownership History
Date
Name
Owned For
Owner Type
Purchase Details
Closed on
Mar 16, 2001
Sold by
Billy Beaver Builders Inc
Bought by
Yanez Fernando and Camacho Leonardo
Current Estimated Value
Home Financials for this Owner
Home Financials are based on the most recent Mortgage that was taken out on this home.
Original Mortgage
$109,906
Outstanding Balance
$40,110
Interest Rate
7.05%
Mortgage Type
FHA
Estimated Equity
$196,847
Purchase Details
Closed on
Dec 15, 2000
Sold by
Gulf Financial Inc
Bought by
Billy Beaver Builders Inc
Purchase Details
Closed on
Nov 7, 2000
Sold by
Billy Beaver Builders Inc
Bought by
Gulf Financial Inc
Purchase Details
Closed on
Aug 26, 1999
Sold by
Pedersen Peder
Bought by
Billy Beaver Builders Inc
Create a Home Valuation Report for This Property
The Home Valuation Report is an in-depth analysis detailing your home's value as well as a comparison with similar homes in the area
Home Values in the Area
Average Home Value in this Area
Purchase History
| Date | Buyer | Sale Price | Title Company |
|---|---|---|---|
| Yanez Fernando | $111,000 | Wheatland Title | |
| Billy Beaver Builders Inc | -- | Wheatland Title | |
| Gulf Financial Inc | -- | -- | |
| Billy Beaver Builders Inc | $7,000 | -- |
Source: Public Records
Mortgage History
| Date | Status | Borrower | Loan Amount |
|---|---|---|---|
| Open | Yanez Fernando | $109,906 |
Source: Public Records
Tax History
| Year | Tax Paid | Tax Assessment Tax Assessment Total Assessment is a certain percentage of the fair market value that is determined by local assessors to be the total taxable value of land and additions on the property. | Land | Improvement |
|---|---|---|---|---|
| 2024 | $4,227 | $69,668 | $8,533 | $61,135 |
| 2023 | $4,054 | $62,248 | $7,624 | $54,624 |
| 2022 | $3,859 | $56,795 | $6,956 | $49,839 |
| 2021 | $3,784 | $52,877 | $6,476 | $46,401 |
| 2020 | $3,586 | $49,115 | $6,015 | $43,100 |
| 2019 | $3,481 | $45,506 | $5,573 | $39,933 |
| 2018 | $3,020 | $39,169 | $5,155 | $34,014 |
| 2017 | $3,079 | $37,395 | $4,750 | $32,645 |
| 2016 | $2,999 | $34,498 | $4,072 | $30,426 |
| 2015 | -- | $30,677 | $3,502 | $27,175 |
| 2014 | -- | $29,017 | $3,218 | $25,799 |
| 2013 | -- | $32,140 | $3,075 | $29,065 |
Source: Public Records
Map
Nearby Homes
Your Personal Tour Guide
Ask me questions while you tour the home.