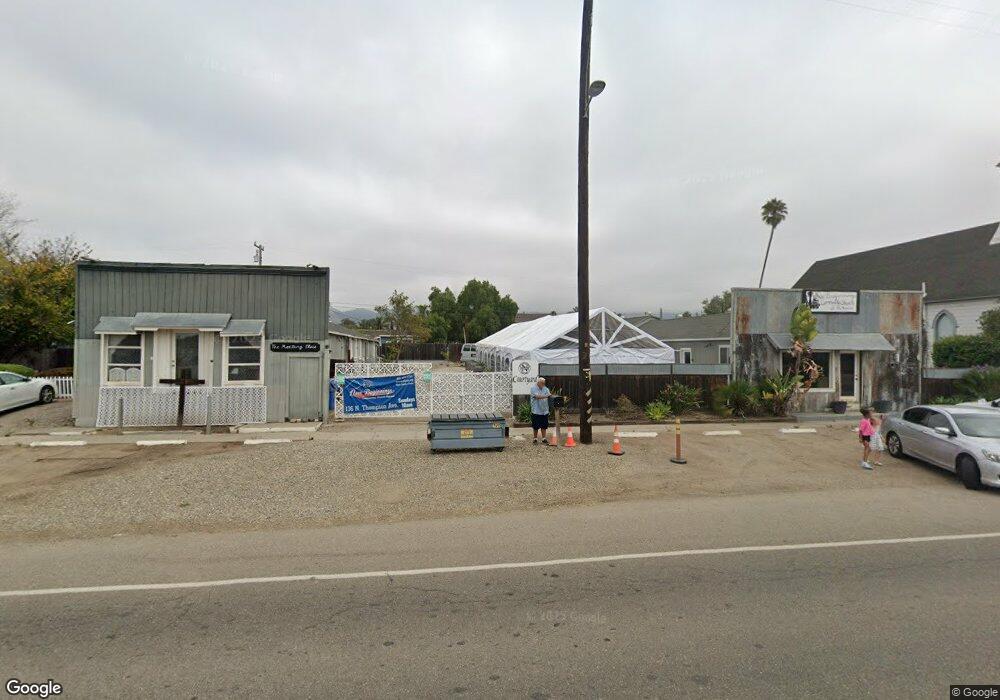
136 N Thompson Ave Unit A Nipomo, CA 93444
Estimated Value: $838,243
--
Bed
--
Bath
4,300
Sq Ft
$195/Sq Ft
Est. Value
About This Home
This home is located at 136 N Thompson Ave Unit A, Nipomo, CA 93444 and is currently estimated at $838,243, approximately $194 per square foot. 136 N Thompson Ave Unit A is a home located in San Luis Obispo County with nearby schools including Nipomo Elementary School, Mesa Middle School, and Nipomo High School.
Ownership History
Date
Name
Owned For
Owner Type
Purchase Details
Closed on
Dec 9, 2021
Sold by
Dill Family 2015 Trust
Bought by
Nipomo New Beginnings Community Church Of The
Current Estimated Value
Home Financials for this Owner
Home Financials are based on the most recent Mortgage that was taken out on this home.
Original Mortgage
$471,250
Interest Rate
3.56%
Mortgage Type
New Conventional
Purchase Details
Closed on
Feb 4, 2016
Sold by
Cecilia Fitz Gerald Properties Llc
Bought by
Dill Brent S
Purchase Details
Closed on
Dec 29, 2011
Sold by
Dana Geraldine Fitz Gerald and Fitz Gerald Michael Edward
Bought by
Cecilia L Fitz Gerald Properties Llc
Purchase Details
Closed on
Apr 7, 1997
Sold by
Simas Marion
Bought by
Oakley David A
Purchase Details
Closed on
Mar 14, 1997
Sold by
Oakley David A
Bought by
Fitz Gerald Cecilia L
Create a Home Valuation Report for This Property
The Home Valuation Report is an in-depth analysis detailing your home's value as well as a comparison with similar homes in the area
Home Values in the Area
Average Home Value in this Area
Purchase History
| Date | Buyer | Sale Price | Title Company |
|---|---|---|---|
| Nipomo New Beginnings Community Church Of The | $725,000 | Placer Title | |
| Dill Brent S | $365,000 | Fidelity National Title Co | |
| Cecilia L Fitz Gerald Properties Llc | -- | None Available | |
| Oakley David A | -- | Fidelity National Title | |
| Oakley David A | -- | Fidelity National Title | |
| Fitz Gerald Cecilia L | $135,000 | Fidelity National Title |
Source: Public Records
Mortgage History
| Date | Status | Borrower | Loan Amount |
|---|---|---|---|
| Previous Owner | Nipomo New Beginnings Community Church Of The | $471,250 |
Source: Public Records
Tax History Compared to Growth
Tax History
| Year | Tax Paid | Tax Assessment Tax Assessment Total Assessment is a certain percentage of the fair market value that is determined by local assessors to be the total taxable value of land and additions on the property. | Land | Improvement |
|---|---|---|---|---|
| 2025 | -- | $769,375 | $318,362 | $451,013 |
| 2024 | -- | $754,290 | $312,120 | $442,170 |
| 2023 | $4,327 | $739,500 | $306,000 | $433,500 |
| 2022 | $4,327 | $407,160 | $223,101 | $184,059 |
| 2021 | $4,319 | $399,177 | $218,727 | $180,450 |
| 2020 | $4,270 | $395,085 | $216,485 | $178,600 |
| 2019 | $4,244 | $387,340 | $212,241 | $175,099 |
| 2018 | $4,193 | $379,746 | $208,080 | $171,666 |
| 2017 | $4,115 | $372,300 | $204,000 | $168,300 |
| 2016 | $1,901 | $178,834 | $137,571 | $41,263 |
| 2015 | $1,874 | $176,149 | $135,505 | $40,644 |
| 2014 | $1,805 | $172,699 | $132,851 | $39,848 |
Source: Public Records
Map
Nearby Homes
- 1 W Branch St
- 0 S Burton St
- 189 E Tefft St
- 150 E Chestnut St
- 90111003 W Price St
- 285 E Tefft St
- 412 N Mallagh St
- 400 N Oakglen Ave
- 449 W Tefft St Unit 23
- 449 W Tefft St Unit 13
- 160 San Antonio Ln
- 525 Grande Ave Unit D
- 368 Avenida de Amigos
- 450 Avenida de Socios Unit 12
- Mesa Plan at Hill Street Terraces - Hill Street Series
- Pacific Plan at Hill Street Terraces - Hill Street Series
- Monarch Plan at Hill Street Terraces - Hill Street Series
- Rancho Plan at Hill Street Terraces - Hill Street Series
- Dana Plan at Hill Street Terraces - Hill Street Series
- 680 Hill St
- 136 N Thompson Ave
- 110 N Thompson Ave
- 146 N Thompson Ave
- 111 E Tefft St
- 110 E Branch St Unit TWO
- 110 E Branch St Unit WE
- 110 E Branch St
- 108 E Branch St
- 120 E Branch St
- 0 Doolittle Way
- 126 E Branch St
- 110 E Tefft St
- 110 E Tefft St Unit A
- 110 E Tefft St Unit B
- 137 E Tefft St
- 112 E Tefft St Unit A
- 112 E Tefft St Unit B
- 0 E Branch St Unit PI147301
- 0 E Branch St Unit PI179147
- 0 E Branch St Unit PI194460