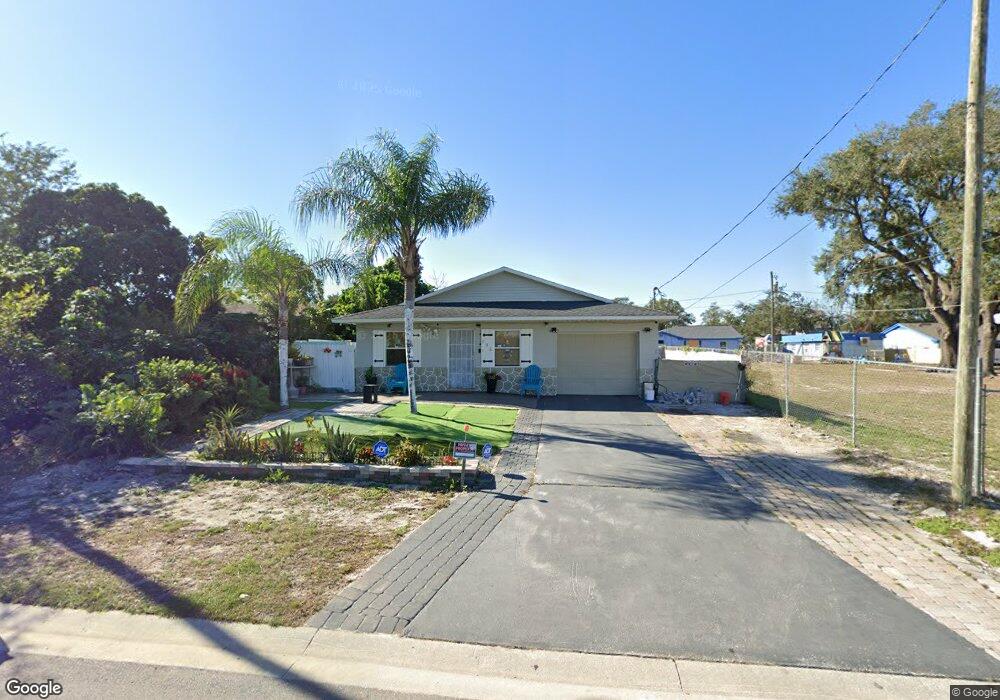
136 N Van Buren Ave Orlando, FL 32811
Malibu Groves NeighborhoodEstimated Value: $237,000 - $250,000
3
Beds
1
Bath
1,060
Sq Ft
$229/Sq Ft
Est. Value
About This Home
This home is located at 136 N Van Buren Ave, Orlando, FL 32811 and is currently estimated at $242,544, approximately $228 per square foot. 136 N Van Buren Ave is a home located in Orange County with nearby schools including Orlo Vista Elementary, Carver Middle School, and Jones High School.
Ownership History
Date
Name
Owned For
Owner Type
Purchase Details
Closed on
May 2, 2014
Sold by
Noomnarm Uthai
Bought by
Coughlin Investment Group Inc
Current Estimated Value
Purchase Details
Closed on
Dec 6, 2000
Sold by
Harrison Mary A
Bought by
Noomnarm Uthai
Home Financials for this Owner
Home Financials are based on the most recent Mortgage that was taken out on this home.
Original Mortgage
$53,124
Interest Rate
7.71%
Mortgage Type
New Conventional
Purchase Details
Closed on
Jun 6, 2000
Sold by
Homeside Lending Inc
Bought by
Sec Of Hud
Purchase Details
Closed on
Nov 5, 1996
Sold by
Sec Of Hod
Bought by
Mazac Properties Inc
Purchase Details
Closed on
Feb 13, 1996
Sold by
Clerk Of The Court
Bought by
Citicorp Mortgage Inc
Create a Home Valuation Report for This Property
The Home Valuation Report is an in-depth analysis detailing your home's value as well as a comparison with similar homes in the area
Home Values in the Area
Average Home Value in this Area
Purchase History
| Date | Buyer | Sale Price | Title Company |
|---|---|---|---|
| Coughlin Investment Group Inc | $40,000 | None Available | |
| Noomnarm Uthai | $65,000 | -- | |
| Harrison Mary A | $58,600 | -- | |
| Sec Of Hud | -- | -- | |
| Mazac Properties Inc | $34,100 | -- | |
| Citicorp Mortgage Inc | $100 | -- |
Source: Public Records
Mortgage History
| Date | Status | Borrower | Loan Amount |
|---|---|---|---|
| Previous Owner | Citicorp Mortgage Inc | $53,124 |
Source: Public Records
Tax History Compared to Growth
Tax History
| Year | Tax Paid | Tax Assessment Tax Assessment Total Assessment is a certain percentage of the fair market value that is determined by local assessors to be the total taxable value of land and additions on the property. | Land | Improvement |
|---|---|---|---|---|
| 2025 | $2,373 | $107,824 | -- | -- |
| 2024 | $2,089 | $98,022 | -- | -- |
| 2023 | $2,089 | $160,720 | $37,500 | $123,220 |
| 2022 | $1,805 | $131,078 | $27,500 | $103,578 |
| 2021 | $1,512 | $92,334 | $24,000 | $68,334 |
| 2020 | $1,379 | $88,919 | $20,000 | $68,919 |
| 2019 | $1,386 | $88,404 | $18,900 | $69,504 |
| 2018 | $1,289 | $79,624 | $11,900 | $67,724 |
| 2017 | $1,208 | $73,985 | $8,000 | $65,985 |
| 2016 | $1,068 | $60,537 | $5,000 | $55,537 |
| 2015 | $1,029 | $56,560 | $5,000 | $51,560 |
| 2014 | $931 | $42,298 | $4,000 | $38,298 |
Source: Public Records
Map
Nearby Homes
- 244 N Hastings St
- 5525 W Central Blvd
- 5435 Roman Ln Unit 50
- 233 N Hudson St
- 25 S Mckinley Ave
- 241 Ronnie Cir
- 313 Ronnie Cir
- 308 Hope Cir
- 223 Hope Cir
- 5910 Old Winter Garden Rd
- 309 Hope Cir
- 217 Wilmer Ave
- 6227 Melbourne Ave
- 402 S Hudson St
- 410 S Hudson St
- 310 N Pine Hills Rd
- 310 Parrish Ave
- 387 N Pine Hills Rd
- 379 N Pine Hills Rd
- 363 N Pine Hills Rd
- 132 N Van Buren Ave
- 121 N Kirkman Rd
- 127 N Van Buren Ave
- 118 N Van Buren Ave
- 120 N Van Buren Ave
- 123 N Van Buren Ave
- 117 N Kirkman Rd
- 119 N Van Buren Ave
- 129 N Kirkman Rd
- 112 N Van Buren Ave
- 115 N Van Buren Ave
- 109 N Kirkman Rd
- 210 N Kirkman Rd
- 111 N Van Buren Ave
- 220 N Kirkman Rd
- 105 N Van Buren Ave
- 34 N Van Buren Ave
- 121 N Hastings St
- 111 N Hastings St
- 30 N Van Buren Ave