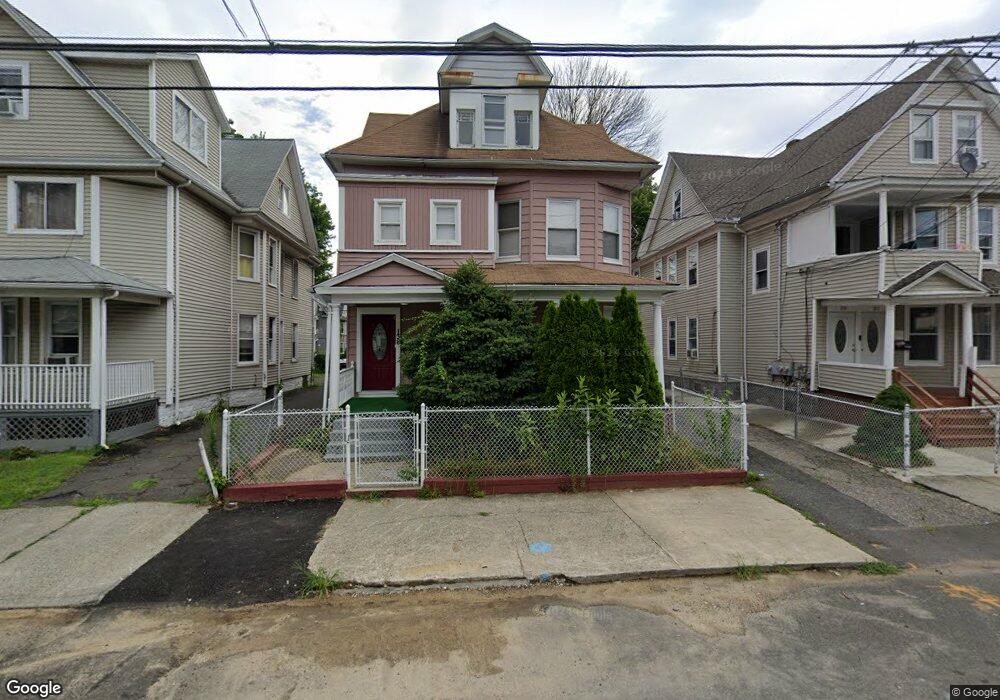
136 Poplar St Bridgeport, CT 06605
West End-West Side NeighborhoodEstimated Value: $433,713 - $478,000
6
Beds
3
Baths
3,125
Sq Ft
$147/Sq Ft
Est. Value
About This Home
This home is located at 136 Poplar St, Bridgeport, CT 06605 and is currently estimated at $458,928, approximately $146 per square foot. 136 Poplar St is a home located in Fairfield County with nearby schools including Bryant Elementary School, Bassick High School, and Park City Prep Charter School.
Ownership History
Date
Name
Owned For
Owner Type
Purchase Details
Closed on
Jan 4, 2006
Sold by
Lafontaine Patrick
Bought by
Sainrilus Jean and Felix Jean
Current Estimated Value
Home Financials for this Owner
Home Financials are based on the most recent Mortgage that was taken out on this home.
Original Mortgage
$290,700
Outstanding Balance
$183,165
Interest Rate
8.4%
Estimated Equity
$275,763
Purchase Details
Closed on
Sep 17, 2001
Sold by
Mondesir Fedner and Mondesir Rosemarie
Bought by
Lafortane Patrick
Home Financials for this Owner
Home Financials are based on the most recent Mortgage that was taken out on this home.
Original Mortgage
$49,900
Interest Rate
6.99%
Purchase Details
Closed on
Jul 10, 1998
Sold by
State Street B & T Co
Bought by
Mondesir Fedner and Mondesir Rosemarie
Purchase Details
Closed on
Jun 15, 1988
Sold by
Robinson Sybil
Bought by
Joseph Simon
Create a Home Valuation Report for This Property
The Home Valuation Report is an in-depth analysis detailing your home's value as well as a comparison with similar homes in the area
Home Values in the Area
Average Home Value in this Area
Purchase History
| Date | Buyer | Sale Price | Title Company |
|---|---|---|---|
| Sainrilus Jean | $306,000 | -- | |
| Sainrilus Jean | $306,000 | -- | |
| Lafortane Patrick | $54,900 | -- | |
| Lafortane Patrick | $54,900 | -- | |
| Mondesir Fedner | $54,900 | -- | |
| Mondesir Fedner | $54,900 | -- | |
| Joseph Simon | $183,000 | -- |
Source: Public Records
Mortgage History
| Date | Status | Borrower | Loan Amount |
|---|---|---|---|
| Open | Joseph Simon | $290,700 | |
| Closed | Joseph Simon | $290,700 | |
| Previous Owner | Joseph Simon | $49,900 |
Source: Public Records
Tax History Compared to Growth
Tax History
| Year | Tax Paid | Tax Assessment Tax Assessment Total Assessment is a certain percentage of the fair market value that is determined by local assessors to be the total taxable value of land and additions on the property. | Land | Improvement |
|---|---|---|---|---|
| 2025 | $7,499 | $172,580 | $52,230 | $120,350 |
| 2024 | $7,499 | $172,580 | $52,230 | $120,350 |
| 2023 | $7,499 | $172,580 | $52,230 | $120,350 |
| 2022 | $7,499 | $172,580 | $52,230 | $120,350 |
| 2021 | $7,499 | $172,580 | $52,230 | $120,350 |
| 2020 | $7,165 | $132,710 | $31,650 | $101,060 |
| 2019 | $7,165 | $132,710 | $31,650 | $101,060 |
| 2018 | $7,215 | $132,710 | $31,650 | $101,060 |
| 2017 | $7,215 | $132,710 | $31,650 | $101,060 |
| 2016 | $7,215 | $132,710 | $31,650 | $101,060 |
| 2015 | $7,588 | $179,810 | $47,870 | $131,940 |
| 2014 | $7,588 | $179,810 | $47,870 | $131,940 |
Source: Public Records
Map
Nearby Homes
- 1033 Howard Ave Unit 1035
- 115 Denver Ave Unit 117
- 870 Hancock Ave Unit 872
- 1050 Hancock Ave Unit 1052
- 1059 Hancock Ave Unit 1061
- 195 Lenox Ave Unit 197
- 47 Lenox Ave
- 246 Lenox Ave
- 1158 Howard Ave
- 725 Beechwood Ave Unit 727
- 1659 Fairfield Ave
- 670 Clinton Ave
- 500 Dewey St
- 485 Laurel Ave
- 860 Colorado Ave Unit 862
- 95 Bedford Ave
- 700 Laurel Ave
- 393 Laurel Ave Unit 415
- 393 Laurel Ave Unit 409
- 2370 North Ave Unit 7C
- 130 Poplar St
- 146 Poplar St
- 132 Poplar St
- 120 Poplar St Unit 2
- 120 Poplar St
- 156 Poplar St Unit 2ND
- 154 Poplar St
- 154 Poplar St Unit 1ST
- 112 Poplar St
- 162 Poplar St
- 133 Poplar St
- 945 Howard Ave
- 139 Poplar St Unit 2nd floor
- 139 Poplar St
- 104 Poplar St
- 135 Poplar St Unit 3
- 119 Poplar St
- 170 Poplar St
- 145 Poplar St
- 137 Poplar St