Estimated Value: $195,000 - $266,000
4
Beds
4
Baths
2,550
Sq Ft
$94/Sq Ft
Est. Value
About This Home
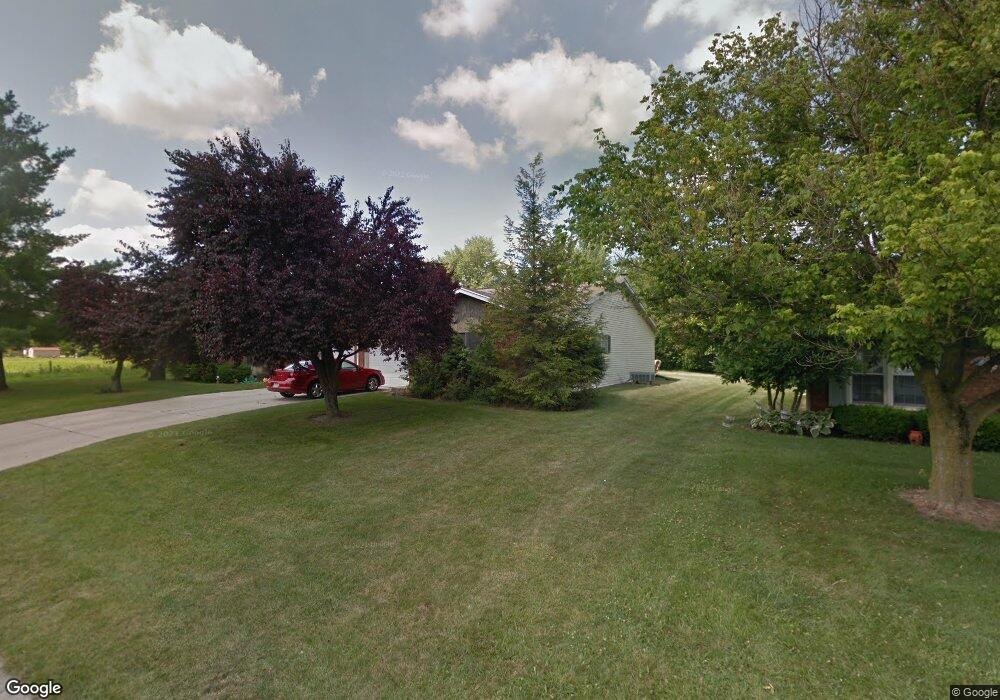
This home is located at 136 Quilna Dr, Lima, OH 45806 and is currently estimated at $240,667, approximately $94 per square foot. 136 Quilna Dr is a home located in Allen County with nearby schools including Elmwood Elementary School, Maplewood Elementary School, and Shawnee Middle School.
Ownership History
Date
Name
Owned For
Owner Type
Purchase Details
Closed on
Jun 14, 2010
Sold by
Jnm Investments
Bought by
Jnm Investments Ltd
Current Estimated Value
Purchase Details
Closed on
Aug 6, 1999
Sold by
Przyblo Anita and Przyblo Sliwinski
Bought by
J N W Investments
Purchase Details
Closed on
May 27, 1997
Sold by
Est Gary Malott
Bought by
Przybylo Anita
Home Financials for this Owner
Home Financials are based on the most recent Mortgage that was taken out on this home.
Original Mortgage
$39,000
Interest Rate
8.24%
Mortgage Type
New Conventional
Purchase Details
Closed on
Mar 22, 1995
Sold by
Starkey Gregory
Bought by
Malott Gary
Home Financials for this Owner
Home Financials are based on the most recent Mortgage that was taken out on this home.
Original Mortgage
$89,600
Interest Rate
8%
Mortgage Type
New Conventional
Purchase Details
Closed on
Apr 30, 1992
Bought by
Starkey Gregory A
Create a Home Valuation Report for This Property
The Home Valuation Report is an in-depth analysis detailing your home's value as well as a comparison with similar homes in the area
Home Values in the Area
Average Home Value in this Area
Purchase History
| Date | Buyer | Sale Price | Title Company |
|---|---|---|---|
| Jnm Investments Ltd | -- | Attorney | |
| J N W Investments | $108,000 | -- | |
| Przybylo Anita | $109,000 | -- | |
| Malott Gary | $112,000 | -- | |
| Starkey Gregory A | $79,000 | -- |
Source: Public Records
Mortgage History
| Date | Status | Borrower | Loan Amount |
|---|---|---|---|
| Previous Owner | Przybylo Anita | $39,000 | |
| Previous Owner | Malott Gary | $89,600 |
Source: Public Records
Tax History Compared to Growth
Tax History
| Year | Tax Paid | Tax Assessment Tax Assessment Total Assessment is a certain percentage of the fair market value that is determined by local assessors to be the total taxable value of land and additions on the property. | Land | Improvement |
|---|---|---|---|---|
| 2024 | $3,462 | $68,780 | $12,430 | $56,350 |
| 2023 | $2,786 | $48,090 | $8,680 | $39,410 |
| 2022 | $2,748 | $48,090 | $8,680 | $39,410 |
| 2021 | $2,759 | $48,090 | $8,680 | $39,410 |
| 2020 | $2,201 | $44,240 | $8,330 | $35,910 |
| 2019 | $2,201 | $44,240 | $8,330 | $35,910 |
| 2018 | $2,193 | $44,240 | $8,330 | $35,910 |
| 2017 | $2,265 | $44,240 | $8,330 | $35,910 |
| 2016 | $2,303 | $44,240 | $8,330 | $35,910 |
| 2015 | $2,101 | $43,930 | $8,330 | $35,600 |
| 2014 | $2,101 | $41,020 | $7,420 | $33,600 |
| 2013 | $2,077 | $41,020 | $7,420 | $33,600 |
Source: Public Records
Map
Nearby Homes
- 137 Caribou Cir
- 3780 Shawnee Rd
- 1934 Jo Jean Rd
- 3744 Linfield Ln
- 3549 Camden Place
- 3467 Weldon Dr
- 3375 Weldon Dr
- 3349 Weldon Dr
- 3337 Weldon Dr
- 3323 Weldon Dr
- 3363 Weldon Dr
- 3372 Weldon Dr
- 3346 Weldon Dr
- 3332 Weldon Dr
- 3320 Weldon Dr
- 3398 Weldon Dr
- 3358 Weldon Dr
- 3386 Weldon Dr
- 2613 Jonathon Dr
- 2691 Jonathan Dr