136 Roberton Crossing Fairfield, CT 06825
Stratfield Village NeighborhoodEstimated Value: $755,372 - $1,064,000
2
Beds
3
Baths
2,286
Sq Ft
$384/Sq Ft
Est. Value
About This Home
This home is located at 136 Roberton Crossing, Fairfield, CT 06825 and is currently estimated at $878,093, approximately $384 per square foot. 136 Roberton Crossing is a home located in Fairfield County with nearby schools including North Stratfield Elementary School, Fairfield Woods Middle School, and Fairfield Warde High School.
Ownership History
Date
Name
Owned For
Owner Type
Purchase Details
Closed on
Jun 30, 2021
Sold by
Jon C Estes Ret
Bought by
Hutchin-Storrier Thomas and Storrier Carolyn B
Current Estimated Value
Home Financials for this Owner
Home Financials are based on the most recent Mortgage that was taken out on this home.
Original Mortgage
$416,250
Outstanding Balance
$377,682
Interest Rate
2.9%
Mortgage Type
Purchase Money Mortgage
Estimated Equity
$500,411
Purchase Details
Closed on
Aug 30, 2013
Sold by
Saxe Elisabeth
Bought by
Estes Jon
Purchase Details
Closed on
May 28, 2004
Sold by
Dorsey Cecelia C
Bought by
Saxe Elizabeth H
Purchase Details
Closed on
Apr 14, 1999
Sold by
Boyd Richard K and Boyd Malinda K
Bought by
Dorsey Patrick B and Dorsey Cecelia
Purchase Details
Closed on
Jul 16, 1991
Sold by
Nicholson Charles W and Nicholson Fay A
Bought by
Boyd Richard K and Boyd Malinda K
Create a Home Valuation Report for This Property
The Home Valuation Report is an in-depth analysis detailing your home's value as well as a comparison with similar homes in the area
Home Values in the Area
Average Home Value in this Area
Purchase History
| Date | Buyer | Sale Price | Title Company |
|---|---|---|---|
| Hutchin-Storrier Thomas | $555,000 | None Available | |
| Hutchin-Storrier Thomas | $555,000 | None Available | |
| Estes Jon | $557,500 | -- | |
| Estes Jon | $557,500 | -- | |
| Saxe Elizabeth H | $559,000 | -- | |
| Saxe Elizabeth H | $559,000 | -- | |
| Dorsey Patrick B | $352,500 | -- | |
| Dorsey Patrick B | $352,500 | -- | |
| Boyd Richard K | $240,000 | -- |
Source: Public Records
Mortgage History
| Date | Status | Borrower | Loan Amount |
|---|---|---|---|
| Open | Hutchin-Storrier Thomas | $416,250 | |
| Closed | Hutchin-Storrier Thomas | $416,250 | |
| Previous Owner | Boyd Richard K | $432,000 | |
| Previous Owner | Boyd Richard K | $492,000 |
Source: Public Records
Tax History Compared to Growth
Tax History
| Year | Tax Paid | Tax Assessment Tax Assessment Total Assessment is a certain percentage of the fair market value that is determined by local assessors to be the total taxable value of land and additions on the property. | Land | Improvement |
|---|---|---|---|---|
| 2025 | $10,561 | $371,980 | $0 | $371,980 |
| 2024 | $10,378 | $371,980 | $0 | $371,980 |
| 2023 | $10,233 | $371,980 | $0 | $371,980 |
| 2022 | $8,685 | $318,850 | $0 | $318,850 |
| 2021 | $8,603 | $318,850 | $0 | $318,850 |
| 2020 | $9,429 | $351,960 | $0 | $351,960 |
| 2019 | $9,429 | $351,960 | $0 | $351,960 |
| 2018 | $9,278 | $351,960 | $0 | $351,960 |
| 2017 | $9,088 | $351,960 | $0 | $351,960 |
| 2016 | $8,957 | $351,960 | $0 | $351,960 |
| 2015 | $9,112 | $367,570 | $0 | $367,570 |
| 2014 | $8,675 | $355,530 | $0 | $355,530 |
Source: Public Records
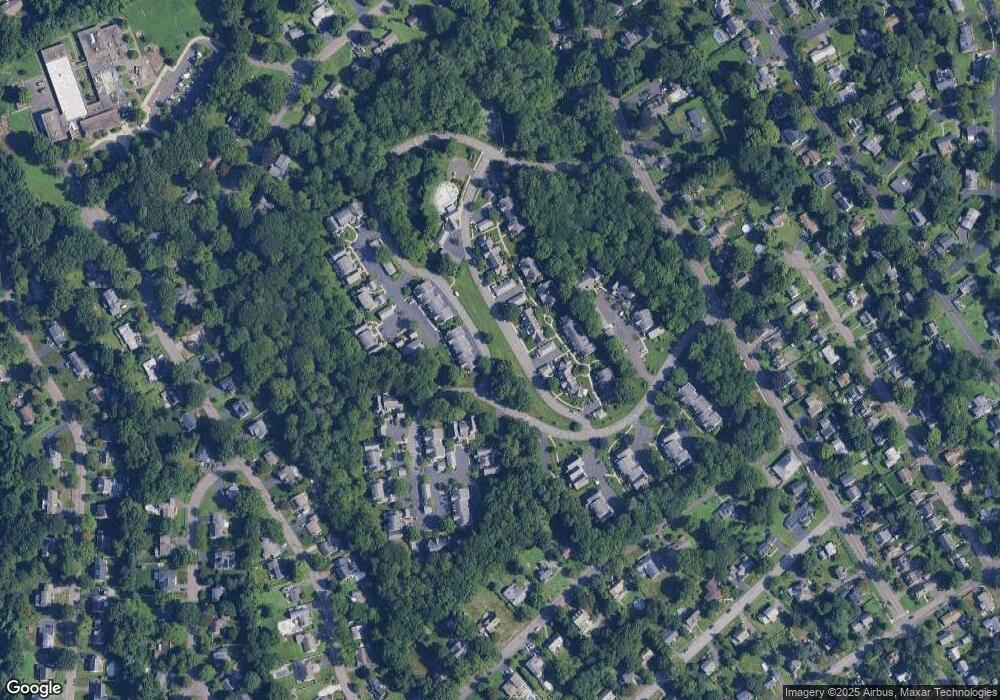
Map
Nearby Homes
- 160 Glengarry Rd Unit 160
- 104 Putting Green Rd
- 893 Church Hill Rd
- 264 Harvester Rd
- 357 Harvester Rd
- 1748 Stratfield Rd
- 273 Wheeler Park Ave
- 71 Schiller Rd
- 30 Falmouth Rd
- 160 Fairfield Woods Rd Unit 35
- 232 Church Hill Rd
- 526 Wilson St
- 419 Valley Rd
- 90 Lu Manor Dr
- 3989 Park Ave
- 984 Valley Rd
- 246 Romanock Rd
- 8 Nelson Place
- 226 Alberta St
- 129 Ashton St
- 136 Roberton Crossing Unit 136
- 134 Roberton Crossing
- 138 Roberton Crossing
- 132 Roberton Crossing
- 130 Roberton Crossing
- 130 Roberton Crossing Unit 130
- 142 Roberton Crossing
- 140 Roberton Crossing
- 128 Roberton Crossing
- 126 Roberton Crossing
- 126 Roberton Crossing Unit 126
- 144 Roberton Crossing
- 144 Roberton Crossing Unit 144
- 144 Roberton Crossing Cross Unit 144
- 146 Roberton Crossing
- 124 Roberton Crossing
- 124 Roberton Crossing Unit 124
- 96 Roberton Crossing Unit 96
- 150 Roberton Crossing
- 148 Roberton Crossing