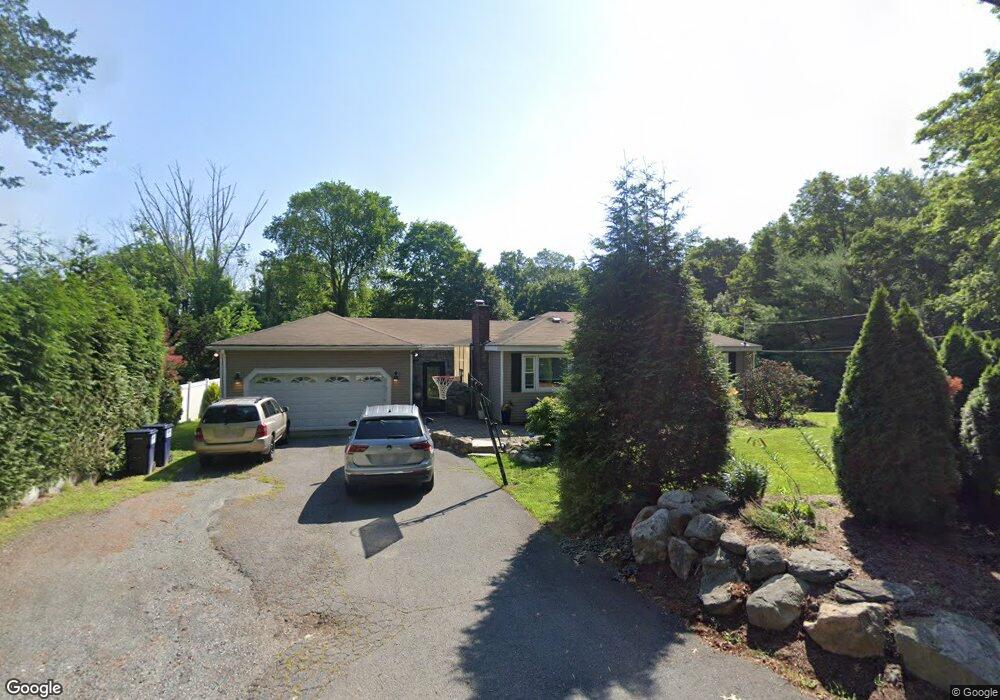
136 S High St Foxboro, MA 02035
Estimated Value: $590,000 - $662,000
3
Beds
2
Baths
998
Sq Ft
$619/Sq Ft
Est. Value
About This Home
This home is located at 136 S High St, Foxboro, MA 02035 and is currently estimated at $617,481, approximately $618 per square foot. 136 S High St is a home located in Norfolk County with nearby schools including Foxborough High School, Foxborough Regional Charter School, and Hands-On-Montessori School.
Ownership History
Date
Name
Owned For
Owner Type
Purchase Details
Closed on
Aug 4, 2010
Sold by
Dunne Thomas E
Bought by
Dunne Thomas E and Dunne Timothy J
Current Estimated Value
Home Financials for this Owner
Home Financials are based on the most recent Mortgage that was taken out on this home.
Original Mortgage
$296,000
Outstanding Balance
$197,556
Interest Rate
4.73%
Mortgage Type
Purchase Money Mortgage
Estimated Equity
$419,925
Purchase Details
Closed on
Sep 29, 2006
Sold by
136 South High St
Bought by
Dunne Thomas E
Home Financials for this Owner
Home Financials are based on the most recent Mortgage that was taken out on this home.
Original Mortgage
$247,200
Interest Rate
6.52%
Mortgage Type
Purchase Money Mortgage
Create a Home Valuation Report for This Property
The Home Valuation Report is an in-depth analysis detailing your home's value as well as a comparison with similar homes in the area
Home Values in the Area
Average Home Value in this Area
Purchase History
| Date | Buyer | Sale Price | Title Company |
|---|---|---|---|
| Dunne Thomas E | -- | -- | |
| Dunne Thomas E | $309,000 | -- |
Source: Public Records
Mortgage History
| Date | Status | Borrower | Loan Amount |
|---|---|---|---|
| Open | Dunne Thomas E | $296,000 | |
| Previous Owner | Dunne Thomas E | $247,200 | |
| Previous Owner | Dunne Thomas E | $61,800 |
Source: Public Records
Tax History Compared to Growth
Tax History
| Year | Tax Paid | Tax Assessment Tax Assessment Total Assessment is a certain percentage of the fair market value that is determined by local assessors to be the total taxable value of land and additions on the property. | Land | Improvement |
|---|---|---|---|---|
| 2025 | $6,380 | $482,600 | $268,100 | $214,500 |
| 2024 | $6,100 | $451,500 | $267,500 | $184,000 |
| 2023 | $5,745 | $404,300 | $255,100 | $149,200 |
| 2022 | $5,740 | $395,300 | $244,400 | $150,900 |
| 2021 | $5,449 | $369,700 | $222,700 | $147,000 |
| 2020 | $5,213 | $357,800 | $222,700 | $135,100 |
| 2019 | $5,029 | $342,100 | $212,300 | $129,800 |
| 2018 | $4,907 | $336,800 | $212,300 | $124,500 |
| 2017 | $4,702 | $312,600 | $198,700 | $113,900 |
| 2016 | $4,606 | $310,800 | $191,600 | $119,200 |
| 2015 | $4,322 | $284,500 | $162,600 | $121,900 |
| 2014 | $4,260 | $284,200 | $159,500 | $124,700 |
Source: Public Records
Map
Nearby Homes
- 132 S High St
- 115 S High St
- 16 Bradner St
- 356 Central St
- 450 West St
- 60 King St
- 150 Rumford Ave Unit 222
- 28 Angell St
- 241-243 N Main St
- 22 Pleasant St Unit B
- 22 Pleasant St Unit A
- 28 Court St
- 28 Court St Unit 4
- 38 Court St
- 76 Samoset Ave
- 99 Pleasant St
- 194 Central St
- 124 E Belcher Rd
- 16 East St Unit 2
- 82 Brook St