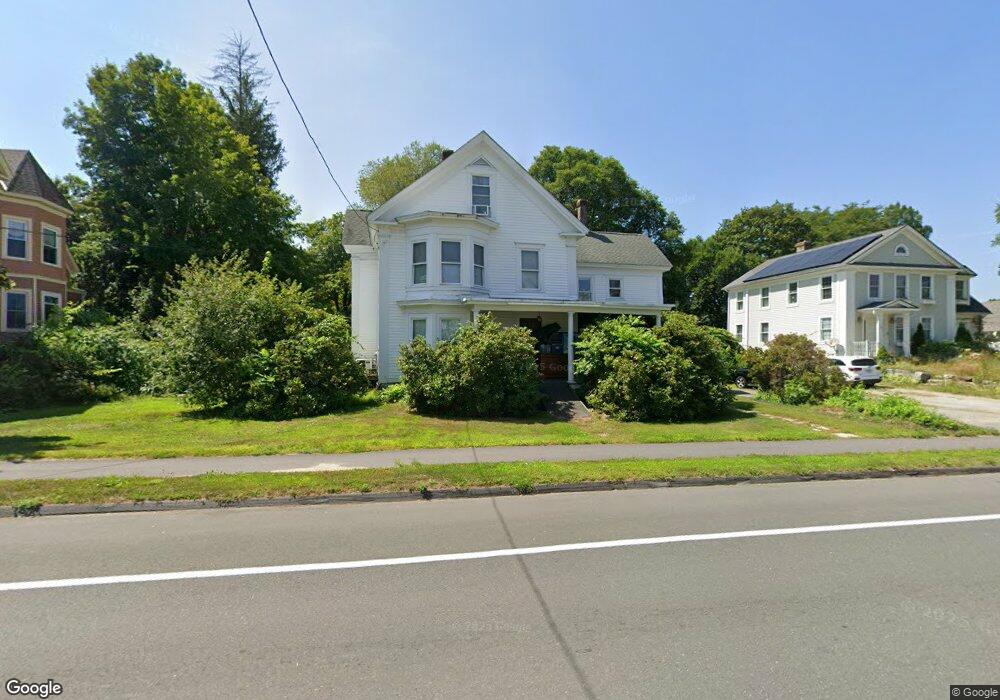
136 S Main St Orange, MA 01364
Estimated Value: $283,000 - $357,000
4
Beds
2
Baths
2,318
Sq Ft
$131/Sq Ft
Est. Value
About This Home
This home is located at 136 S Main St, Orange, MA 01364 and is currently estimated at $304,714, approximately $131 per square foot. 136 S Main St is a home located in Franklin County with nearby schools including Fisher Hill and Ralph C Mahar Regional School.
Ownership History
Date
Name
Owned For
Owner Type
Purchase Details
Closed on
Aug 23, 1989
Sold by
Abbott Theresa M
Bought by
Whitman Eric G
Current Estimated Value
Create a Home Valuation Report for This Property
The Home Valuation Report is an in-depth analysis detailing your home's value as well as a comparison with similar homes in the area
Home Values in the Area
Average Home Value in this Area
Purchase History
| Date | Buyer | Sale Price | Title Company |
|---|---|---|---|
| Whitman Eric G | $107,000 | -- |
Source: Public Records
Mortgage History
| Date | Status | Borrower | Loan Amount |
|---|---|---|---|
| Open | Whitman Eric G | $120,000 | |
| Closed | Whitman Eric G | $50,000 | |
| Closed | Whitman Eric G | $101,240 | |
| Closed | Whitman Eric G | $102,989 |
Source: Public Records
Tax History
| Year | Tax Paid | Tax Assessment Tax Assessment Total Assessment is a certain percentage of the fair market value that is determined by local assessors to be the total taxable value of land and additions on the property. | Land | Improvement |
|---|---|---|---|---|
| 2025 | $37 | $223,200 | $28,200 | $195,000 |
| 2024 | $3,465 | $198,700 | $28,200 | $170,500 |
| 2023 | $3,436 | $191,300 | $25,400 | $165,900 |
| 2022 | $3,187 | $166,700 | $25,400 | $141,300 |
| 2021 | $2,945 | $146,900 | $44,400 | $102,500 |
| 2020 | $2,558 | $125,800 | $40,500 | $85,300 |
| 2019 | $2,515 | $111,700 | $35,000 | $76,700 |
| 2018 | $2,503 | $114,100 | $32,700 | $81,400 |
| 2017 | $2,422 | $114,100 | $32,700 | $81,400 |
| 2016 | $2,213 | $102,000 | $29,200 | $72,800 |
| 2015 | $2,214 | $106,600 | $31,200 | $75,400 |
| 2014 | $2,517 | $127,500 | $31,200 | $96,300 |
Source: Public Records
Map
Nearby Homes
- 12-14 E Main St
- 58 E Main St
- 50 E Main St
- 270 S Main St
- 83 W Main St
- 36 Summit St Unit A
- 36 Summit St Unit B
- 35 Ball St
- 222 W River St
- 166-168 W Main St
- 23 E Howe St
- 39 Terrace St
- 56 Shelter St
- 490 S Main St
- 00 S Main St
- 000 S Main St
- 0 Quabbin Blvd
- 549 E Main St
- 216 Holtshire Rd
- 246 Holtshire Rd Unit Lot 3
Your Personal Tour Guide
Ask me questions while you tour the home.