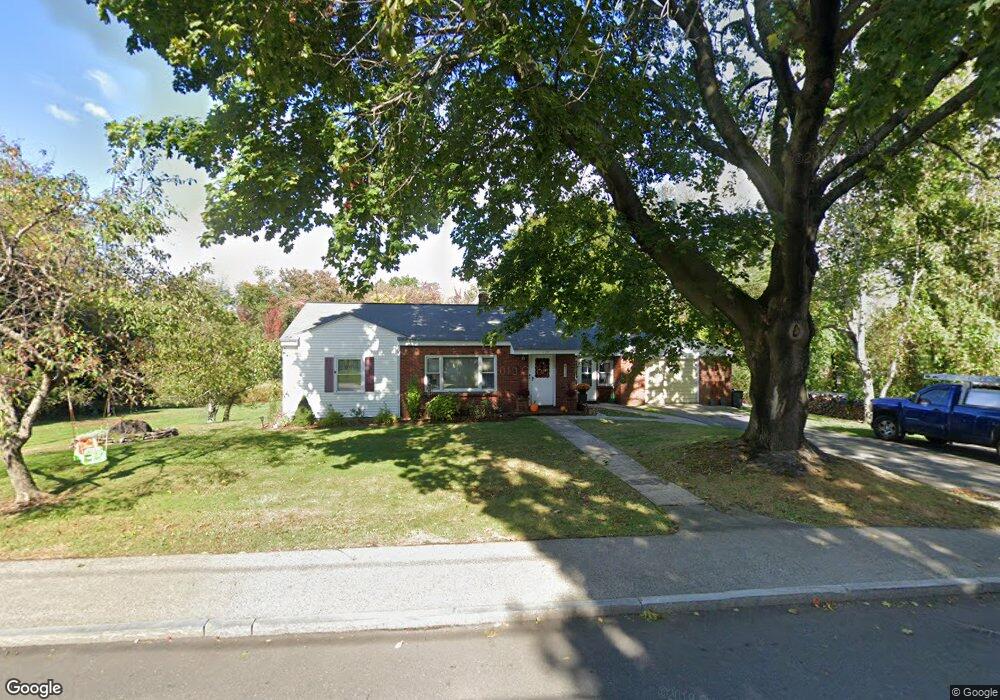
136 Salem St Andover, MA 01810
Phillips Academy NeighborhoodEstimated Value: $852,522 - $971,000
3
Beds
2
Baths
1,866
Sq Ft
$477/Sq Ft
Est. Value
About This Home
This home is located at 136 Salem St, Andover, MA 01810 and is currently estimated at $889,881, approximately $476 per square foot. 136 Salem St is a home located in Essex County with nearby schools including Bancroft Elementary School, Doherty Middle School, and Andover High School.
Ownership History
Date
Name
Owned For
Owner Type
Purchase Details
Closed on
Jun 3, 2019
Sold by
Douty William F
Bought by
Normandie Heather and Normandie John W
Current Estimated Value
Home Financials for this Owner
Home Financials are based on the most recent Mortgage that was taken out on this home.
Original Mortgage
$378,000
Outstanding Balance
$330,970
Interest Rate
4.1%
Mortgage Type
New Conventional
Estimated Equity
$558,911
Purchase Details
Closed on
Jan 2, 2008
Sold by
Douty Carol Jacquelin
Bought by
Douty 3Rd William F
Create a Home Valuation Report for This Property
The Home Valuation Report is an in-depth analysis detailing your home's value as well as a comparison with similar homes in the area
Home Values in the Area
Average Home Value in this Area
Purchase History
| Date | Buyer | Sale Price | Title Company |
|---|---|---|---|
| Normandie Heather | $540,000 | -- | |
| Douty 3Rd William F | -- | -- | |
| Douty 3Rd William F | -- | -- |
Source: Public Records
Mortgage History
| Date | Status | Borrower | Loan Amount |
|---|---|---|---|
| Open | Normandie Heather | $378,000 |
Source: Public Records
Tax History Compared to Growth
Tax History
| Year | Tax Paid | Tax Assessment Tax Assessment Total Assessment is a certain percentage of the fair market value that is determined by local assessors to be the total taxable value of land and additions on the property. | Land | Improvement |
|---|---|---|---|---|
| 2024 | $9,554 | $741,800 | $509,900 | $231,900 |
| 2023 | $9,132 | $668,500 | $459,300 | $209,200 |
| 2022 | $8,569 | $586,900 | $406,500 | $180,400 |
| 2021 | $8,185 | $535,300 | $369,600 | $165,700 |
| 2020 | $7,844 | $522,600 | $360,500 | $162,100 |
| 2019 | $7,288 | $477,300 | $319,300 | $158,000 |
| 2018 | $6,985 | $446,600 | $301,200 | $145,400 |
| 2017 | $6,672 | $439,500 | $295,400 | $144,100 |
| 2016 | $6,230 | $420,400 | $276,300 | $144,100 |
| 2015 | $6,013 | $401,700 | $265,800 | $135,900 |
Source: Public Records
Map
Nearby Homes